Experiment
Our main project concept is to recreate a Hoberman Sphere out of DNA origami with strands of CpG attached to it, which can modulate immune function. However, considering the complexities of creating 3D wireframe structures and our short time period, our experimental methods focused on attaching viable handles to a flight ring instead, which is one flat unit of the Hoberman structure. These handles could later have CpG strands attached to them. Successful modification of the flight ring structure demonstrates the viability of a future Hoberman sphere wireframe origami.
Our experiment was broken into two main parts:
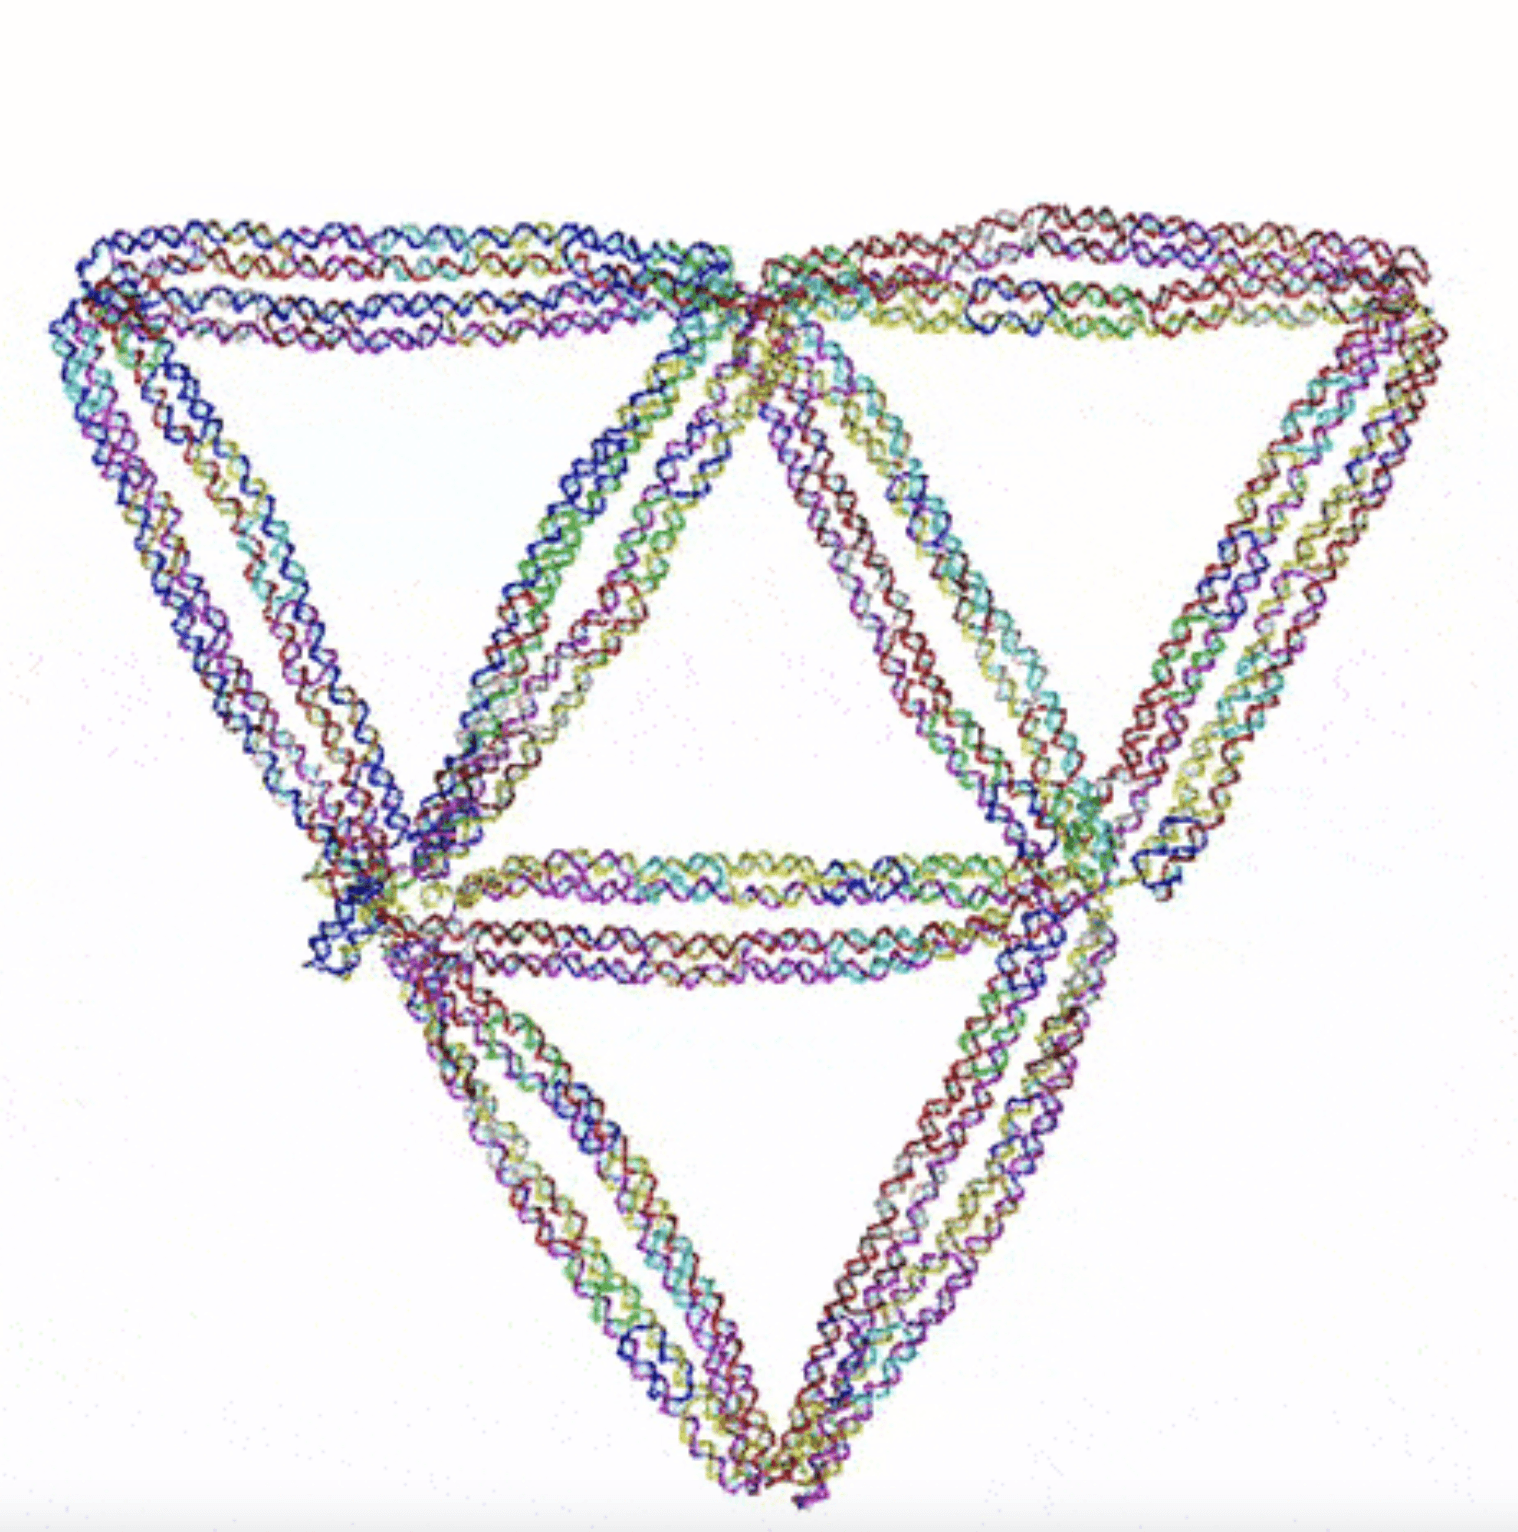
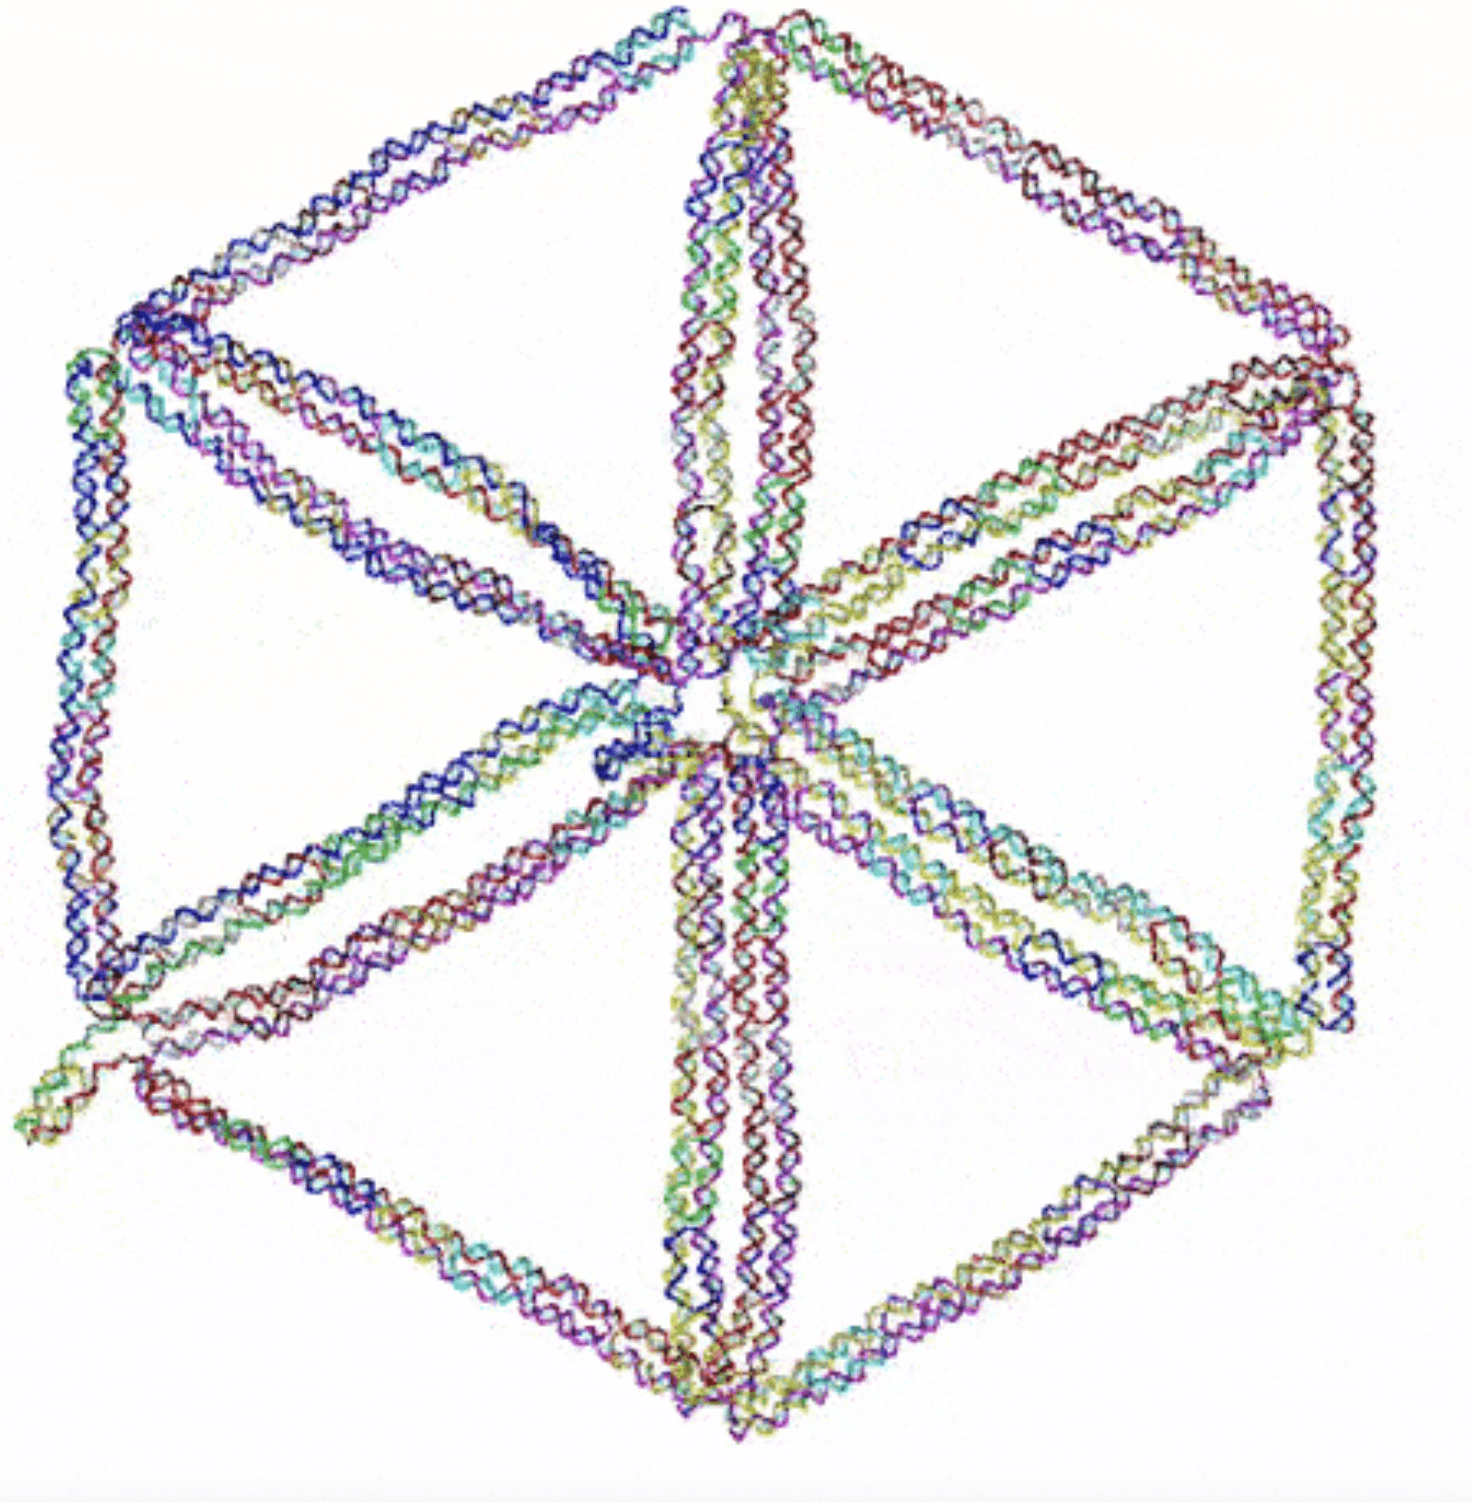
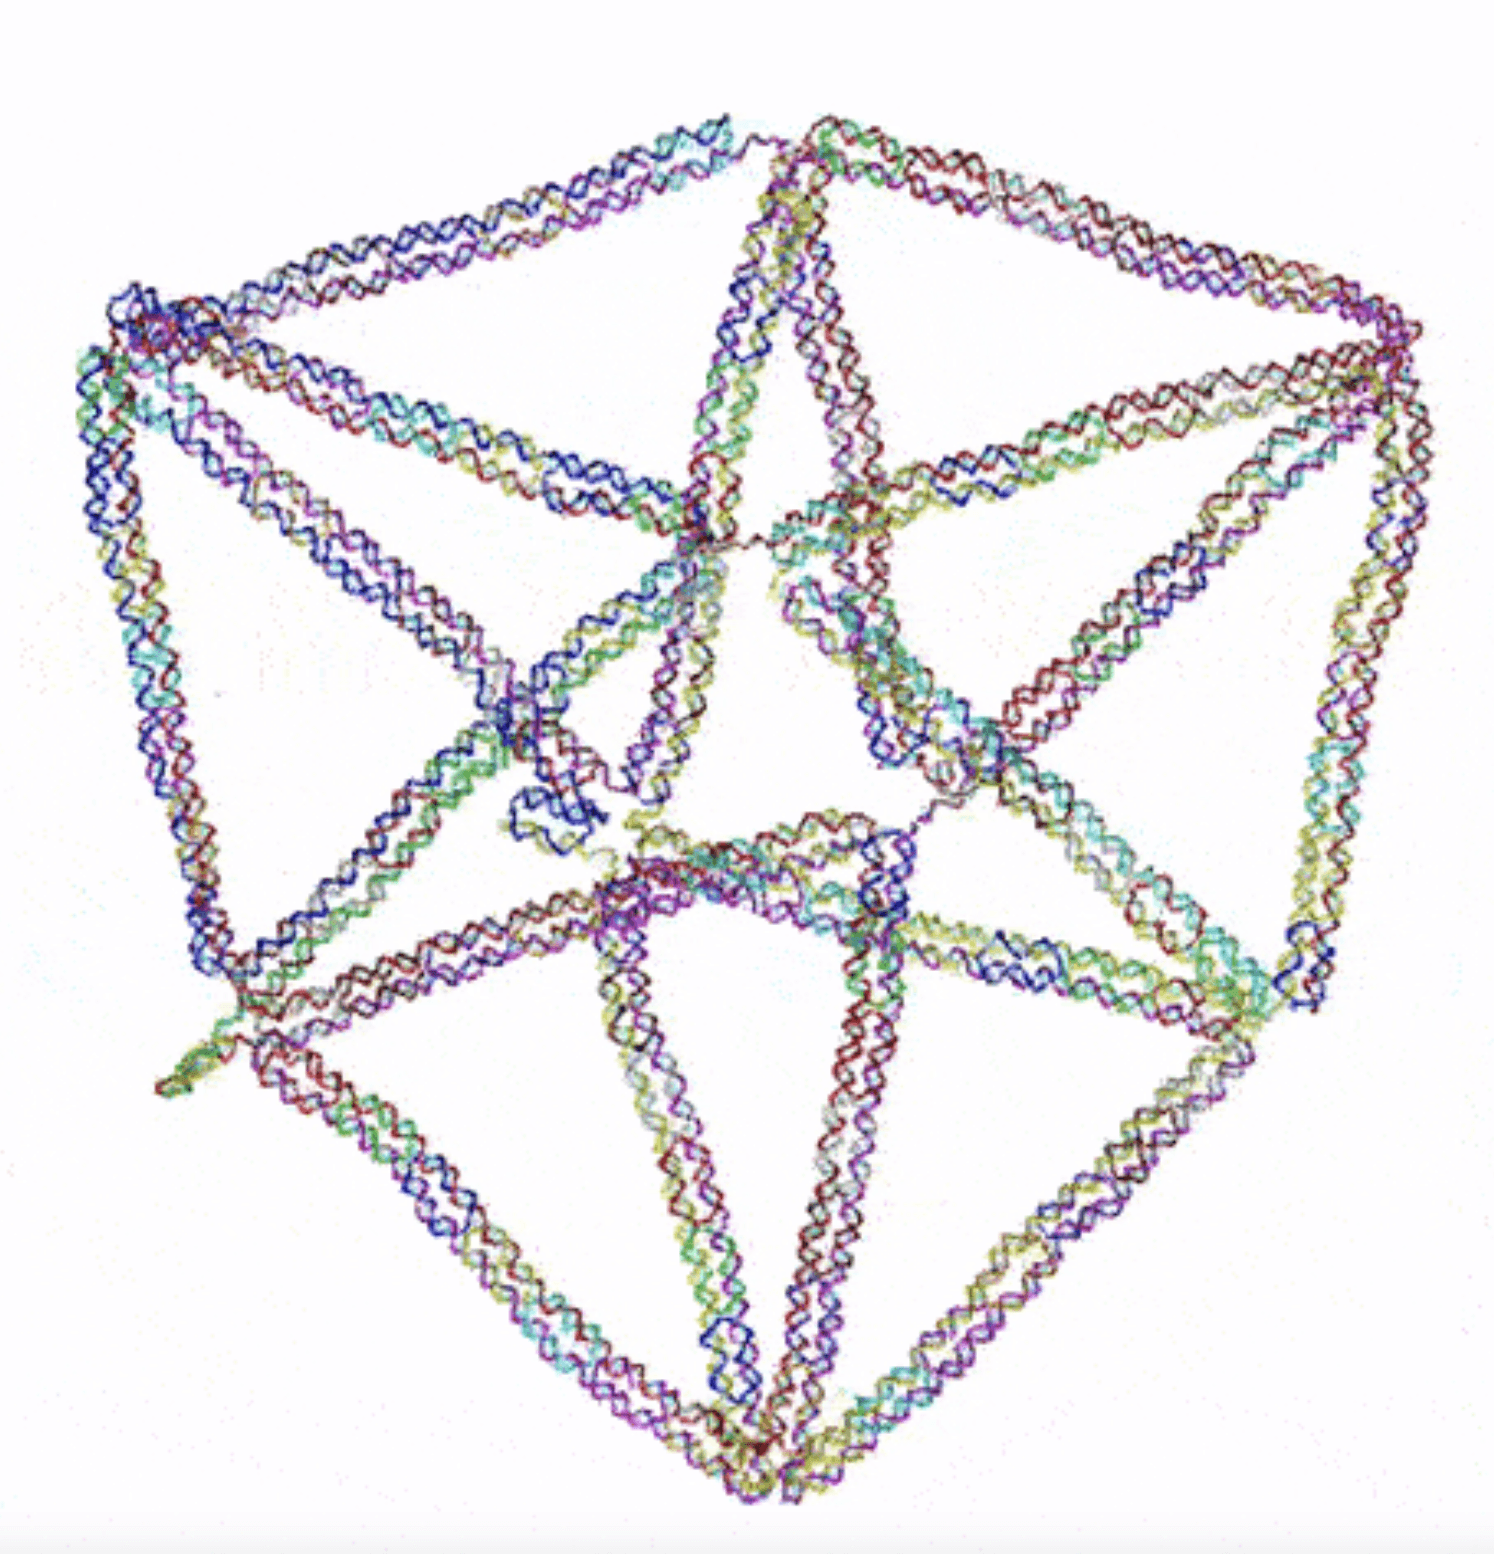
Assembling a 2D flight ring from Li et al.’s (2021) Topological Assembly of a Deployable Hoberman Flight Ring from DNA paper
Attaching FRET strand handles to the flight ring, based on our computational designs.
Within this, we also explored purification methods of wireframe structures and the viability of using oligolysine coating to make our origami more biocompatible and resilient to human biology.
Our team is extremely grateful to the University of Sydney’s DNA Nano Group (and colleagues) for training, supervising, and providing expert assistance during the experimental phase of our project. Their expertise in DNA origami folding, purification methods, microscopy, and FRET was essential to the project's success.
Please see our lab notebook below.
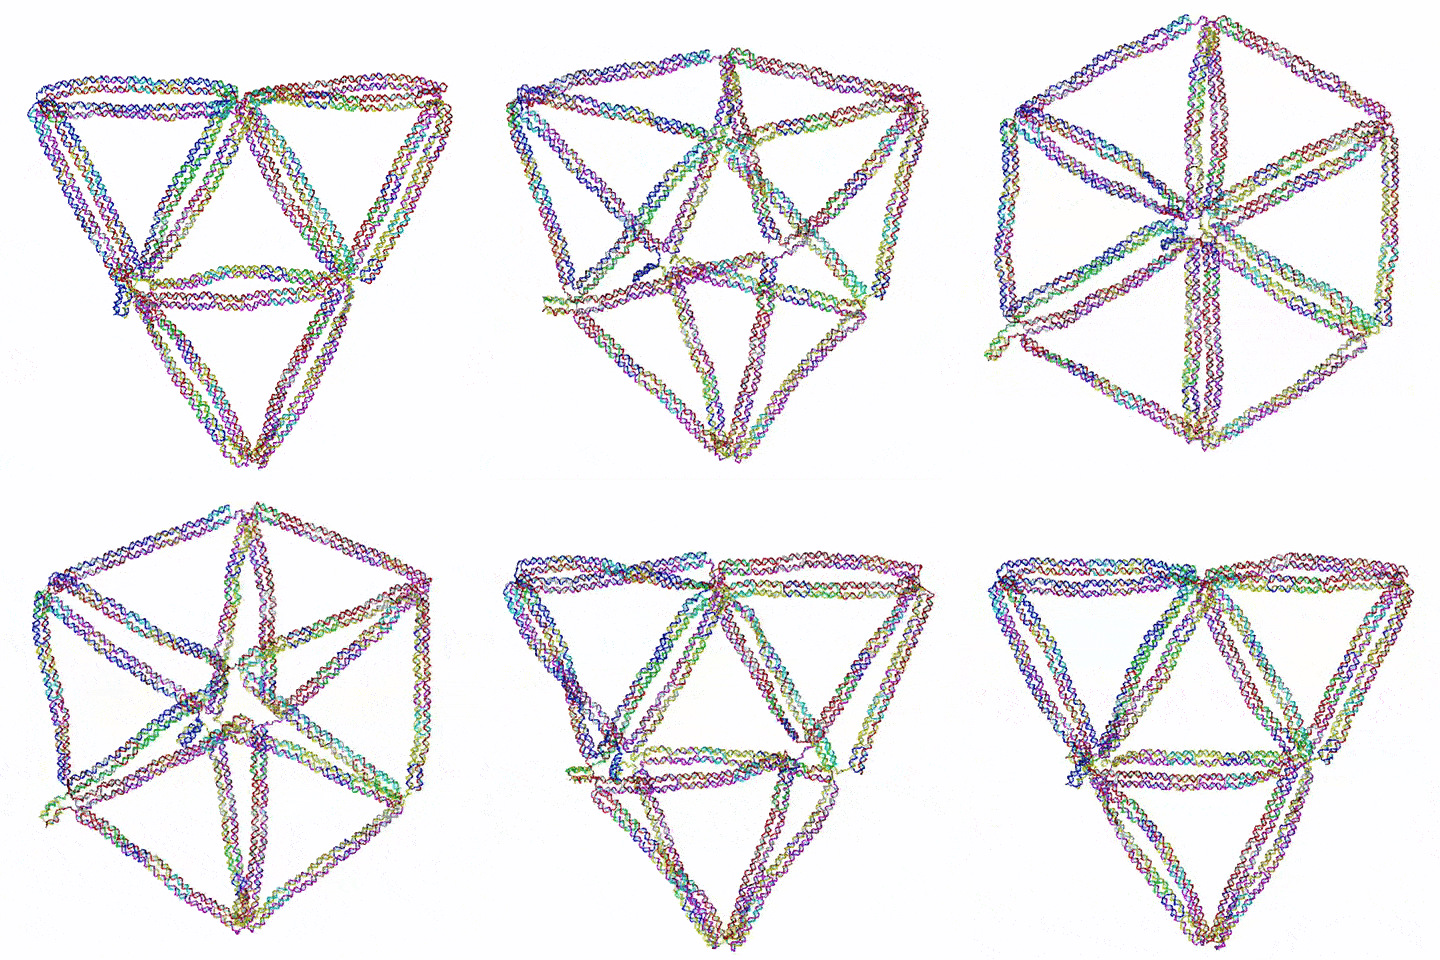
Figure 1: Visualisation of the 2D flight ring created in the paper Li et al.’s (2021) Topological Assembly of a Deployable Hoberman Flight Ring from DNA. Retrieved from (Pike, Jarod, n.d.)
Table 1: Pool List
Pool Name
Number of oligos
Concentration (μM)
Vol each oligo (μL)
Total vol oligos (μL)
MilliQ water (μL)
Final concentration (μM)
Undefined Configuration
133
200
5
665
335
1
Open Jack Strands
16
200
5
80
420
2
Closed Jack Strands
4
200
5
20
480
2
Release Open Strands
16
200
5
80
420
2
Release Closed Strands
4
200
5
20
480
2
We assembled the flight ring in both the closed and open states. 5 nM of an M13mp18 scaffold strand (also referred to as p7249) was mixed with a 4-fold relative concentration of DNA staples in folding buffer (FB contains 1x TE buffer + 6 mM MgCl₂) (Table 2). For the undefined structure, only the undefined staples pool was mixed in. For the open state, the undefined staples pool & the open jack strands pool were added, and for the closed state, the undefined staples pool & the closed jack strands pool were added. The mixtures were annealed in a thermocycler following this cycle:
annealed from 95 to 65 °C at −1 °C per 2 min;
from 65 to 60 °C at −1 °C per 25 min;
from 60 to 50 °C at −1 °C per 60 min;
from 50 to 45 °C at −1 °C per 25 min;
from 45 to 25 °C at −1 °C per 2 min;
and finally, held at 4 °C.
We measured the concentration of the annealed structure via absorbance using a NanoDrop Spectrophotometer.
Table 2: Mixture for annealing the flight ring. The red open pool is included to make an open configuration flight ring but could be swapped for a closed pool to make a closed configuration flight ring or be replaced with water for an undefined structure.
Flight ring
Final Concentration (nM)
Vol. (µL)
Initial concentration (nM)
Scaffold 7249
5
12
100
Undefined pool
20
4.8
1000
Open jack strands pool
20
2.4
2000
FB
6,000,000
24
60,000,000
H₂O
196.8
0
Total
240
Step 2. Strand displacement protocol
Using oligonucleotide pools of 'releaser strands,' we initiated toehold-mediated strand displacement to remove the 'jack strands' from the synthesised origami through incubation. The synthesised DNA flight rings were mixed with 10x releaser strands and FB (contains 1x TE buffer + 6 mM MgCl₂). This mixture was incubated in the thermocycler at 60 ºC, which enabled toehold-mediated strand displacement. This essentially removes the jacks keeping the flight ring in a closed/open state, unlocking the flight ring to be in the undefined state.
Table 3: Mixture for strand displacement. The red release open pool is included to release the open configuration into an undefined structure but could be swapped with release closed strands to release a closed configuration flight ring.
Final Concentration (nM)
Vol. (µL)
Initial concentration (nM)
Flight ring
5
30.9
19.4
Release open strands pool
50
3
2,000
FB
6,000,000
12
60,000,000
H₂O
74.1
Total
120
The undefined-state flight rings were then purified. We tested 4 purification methods to ensure the greatest yield possible—see Step 4 testing purification method and results below. We measured the concentration of the annealed structure using a Nanodrop spectrophotometer.
Step 3. Reannealing the flight ring
To lock the undefined state into a specific shape again, 20x staple strands from the closed or open pools were mixed with the purified structures. The mixture was annealed in the thermocycler, via incubation at 45 °C for 1 h. Following, the temperature was reduced from 45 to 20 °C at −1 °C per 1 min (for a total of 25 min for cooling). After the incubation, the mixture was held at 4 °C.
Table 4: Mixture for reannealing the flight ring from an undefined state. The red closed pool is included to make a closed configuration flight ring but could be swapped for an open pool.
Final Concentration (nM)
Vol. (µL)
Initial concentration (nM)
Product from Step 2
1
40
1.5
Closed pool
20
0.6
2,000
FB
6,000,000
6
60,000,000
H₂O
13.4
Total
60
Step 4. Testing Purification
After strand displacement, we purified the structure to isolate the undefined state origami from excess releaser staples, ensuring reacted single-stranded DNA (ssDNA) would be removed and unable to interact with the new staples. We also purified the reconfigured closed flight rings in preparation for TEM imaging. Wireframe structures are often difficult to purify due to the complexity of their closed scaffolds, so that optimisation is usually required. We wanted to ensure we got the highest possible yield of origami from each step, so we tested 4 methods of purification, including the one in Li et al.’s (2021) paper.
Method 1: Amicon purification, as described in Li et al. (2021)
“purifications were performed three times by using the centrifugal filter (100 kDa) from Amicon. At each time, ≈60 µL DNA solution was mixed with FB to reach 500 µL and was rapidly put on centrifugation at 5000 rpm for 3 min. The solution which passed through the filter was discarded and the solution left in the filter (≈60 µL) was collected for the next filtration.”
The yield dropped dramatically from 19.4 nM to 1.5 nM after the Amicon purification (Figure 2 and Table 5), so we went on to investigate other purification methods.
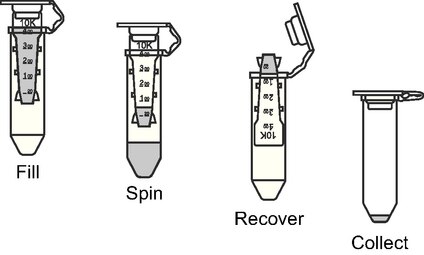
Figure 2: Purification protocol using centrifugal filter (100 kDa) from Amicon (Amicon Centrifugal Filters, n.d.)
Method 2: PEG precipitation
This method adds poly(ethylene glycol) (PEG) polymers to an unpurified solution to induce the depletion of species with high molecular weight. The PEG polymers act as a crowding agent to the solution, taking up space in the solution such that the heavier DNA structures like origami precipitate at the bottom, and the excess strands are separated into the supernatant (Figure 3). PEG purification generally allows more control over the concentration of the final product (Stahl et al., 2014).
Figure 3: PEG purification protocol (Stahl et al., 2014)
To our knowledge, there is no research available on using PEG precipitation to purify DNA origami wireframe structures. Previous work has successfully used PEG precipitation for other types of origami such as 2D and 3D dense and hollow structures (Knappe et al., 2022; Stahl et al., 2014; Wickham et al., 2020), including investigation within the University of Sydney DNA Nano group. This is likely due to the flexibility of wireframe structures; wireframe structures have low crossover density compared to lattice-based structures, reducing their overall stability and allowing them to fold in more unexpected ways (Singh et al., 2022). As there is a lack of studies on purifying wireframe structures using PEG precipitation, it is largely unknown how origami interacts with PEG, especially considering precipitating purification methods interact more thermodynamically compared with filtration methods (Knappe et al., 2022).
We trialled two different precipitation buffers, one with 15% PEG 8000 (w/v) and one with 20% PEG 8000 (w/v), based on the methods in Stahl et al. (2014) and PEG conditions for 2D structures used by members of the University of Sydney DNA Nano group previously.
The annealed DNA origami mixture was mixed 1:1 with a PEG precipitation buffer. This buffer originally contained 15% w/v PEG8k, 5 mM Tris, 1 mM EDTA, and 505 mM NaCl. Using 15% w/v PEG8k did not produce a high yield of DNA origami (0.2 nM and 0.2 nM in Table 5), so we then changed the buffer to have 20% w/v PEG8k instead, as a higher concentration of PEG takes up more space in the solution, forcing the heavier folded DNA structures to the bottom of the tube as a precipitate.
The solution was centrifuged at 16,000 g at room temperature for 25 minutes. We removed the supernatant carefully with a pipette, ensuring we didn’t disrupt the pellet. We resuspended the pellet in 1xFB and put it in the thermoshaker for 1.5 hours at 30 ºC, 1000 rpm. The solution was once again mixed 1:1 with the PEG precipitation buffer and then put into the centrifuge under the original conditions for a second run. Again, we removed only the supernatant. The pellet was then dissolved in 1xFB to our desired volume and put in the thermoshaker for 2 hrs at 30 ºC, 1000 rpm.
20% w/v PEG 8k conditions gave a much higher yield than the 15% w/v PEG 8k, and purifying the open flight rings worked much better than purifying the closed flight rings in both cases, especially for 20% w/v PEG 8k (Table 5). The difference between closed and open configurations could be due to an error or unoptimised PEG protocol for this particular wireframe structure.
Method 3: Agarose Gel Electrophoresis (AGE) extraction
As we performed agarose gel electrophoresis (AGE) to confirm structural changes, extracting the pure DNA origami from our gels made a lot of sense. As the gel electrophoresis separated the unused staples and releaser strands from the origami, cutting the gel bands and extracting the DNA should give us a pure origami sample, though this typically does not have the highest yield (Figure 4, Stahl et al., 2014). The results demonstrated that AGE extraction did not give a high yield either, showing 1.2 nM and 0.9 nM after purification of closed configuration and undefined configuration (Table 5).
Method 4: skipping purification and adding excess staples
This method skips purification altogether. When reannealing the flight ring, rather than adding 20x staples we added 40x staples. This gave a satisfactory high yield at 3.2 nM and 10.8 nM in reannealed open and closed configurations (Table 5), though we would have been unable to confirm the restructuring of the origami without further purification as images would be too crowded, and AGE purifies the samples anyway.
Table 5: concentration of DNA origami in solution at different structural stages using different methods of purification.
Origami State
Purification Method
Concentration (ng/μL | nM)
Open flight ring, from original origami synthesis
Unpurified
AGE extraction
86
4.8
19.4
1.1
Undefined state, from the open flight, rings undergone strand displacement
Unpurified
Amicon purification
PEG purification (15%)
PEG purification (20%)
AGE extraction
25.3
6
1
36.3
4.2
6
1.5
0.2
8.6
1
Closed flight rings reannealed from undefined state (which came from open flight rings)
Amicon purification
Skip purification, add excess staples
7.3
13.7
1.7
3.2
Closed flight rings, from the original origami synthesis
Unpurified
AGE extraction
76
5.3
17.8
1.2
Undefined state, from the closed flight, rings undergone strand displacement
Unpurified
Amicon purification
PEG purification (15%)
PEG purification (20%)
AGE extraction
12.4
9.2
0.7
3.4
3.9
2.9
2.2
0.2
0.8
0.9
Open flight ring reannealed from undefined state (which came from closed flight ring)
Amicon purification
Skip purification, add excess staples
12.6
47.8
2.8
10.8
For the open → undefined → closed structural change,
the 20% w/v PEG 8k purification method
following strand displacement was the most successful method by far, as seen by the 8.6 nM yield compared to only 1.5 nM with Amicon purification and 1.0 nM with AGE extraction.
For the closed → undefined → open structural change, the 20% w/v PEG 8k purification method following strand displacement was quite low yield at only 0.8 nM. For this change, the Amicon purification worked the best and provided good enough yield and clarity for TEM imaging. The reason for the high disparity between yields of DNA for the undefined structures is likely due to either experimental error or simply that it is difficult to purify wireframe structures. Considering both samples for 20% w/v PEG 8k purification are in the undefined state, they should be the same shape. The drastic difference in yield, 8.6 nM compared to 0.8 nM, suggests experimental error as opposed to difficulties with the structure, as the same structure should have a similar purification result.
Characterization
1. Agarose Gel Electrophoresis
We used AGE to confirm the successful folding and restructuring of DNA origami and to purify it for extraction. Gel electrophoresis works by applying an electric field through the gel matrix, which separates DNA fragments based on size and charge, with smaller fragments travelling faster and farther. Partially folded DNA fragments and free staples migrate farther down the gel, while fully folded DNA origami typically stops at a predictable distance. We confirm successful folding by comparing the position of the distinct origami band to a ladder with known base pair sizes and other origami bands of similar size.
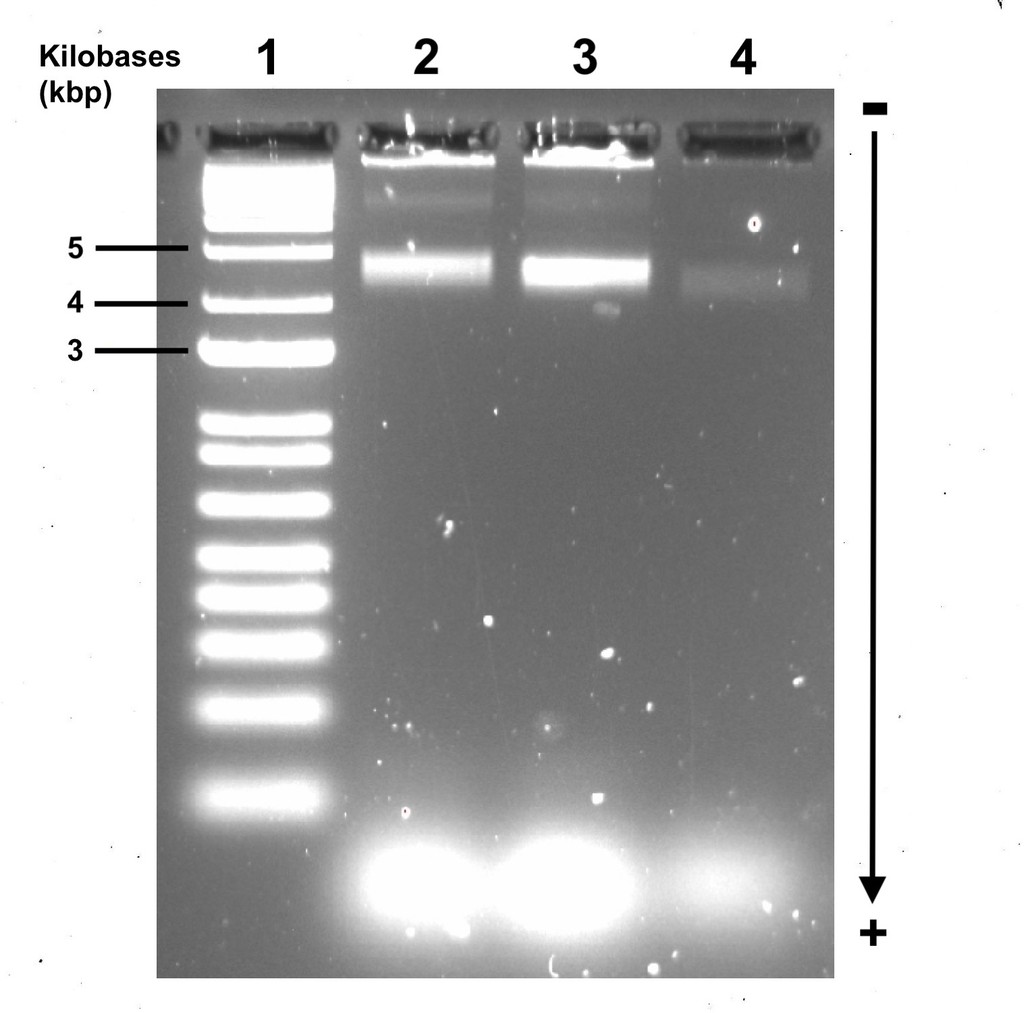
Figure 4. Agarose gel electrophoresis (2% agarose, 0.5X TAE buffer) ran at 60V for 4 hours, visualised with Sybr Safe stain. Lane 1 contains the size standard (BioLabs 1 kbp ladder). Lane 2 contained the annealed open flight ring origami, Lane 3 contained the annealed closed flight ring origami, and Lane 4 contained the undefined structure that came from open flight rings that underwent strand displacement. All other lanes contained loading dye and water.
The very faint bands in Lane 4 is due to the concentration of the undefined structures being insufficient, potentially due to the low yield of origami successfully transitioning through strand displacement or experimental error during AGE. Though the bands are still clearly there, we will discuss the results as if the bands were clearer.
According to Li et al. (2017), the weight of the DNA origami states from heaviest to lightest should be open, closed, and then undefined configurations (approximately 4.44 kbp, 4.29 kbp, and 4.23 kbp respectively). The AGE results we obtained are consistent with the paper, as the open flight rings travelled less distance than the closed flight rings, and the closed flight rings travelled less far than the undefined structures. The undefined structures are the same size as each other. The bands are distinct enough from each other that we can confirm the origami has successfully folded and refolded. Additionally, they sit between 4 and 5 kbp respectively to the size standard ladder (Figure 4), confirming the bands likely contain the origami we intended to make. With this confirmation, we then excised the bands from the gel and extracted the DNA, which should be the purified origami.
2. TEM Imaging
Transmission electron microscopy (TEM) is a technique that transmits high-energy electrons through a nanoscale sample, creating a high-resolution visualisation of the structure as the electrons pass through and interact with it. We used TEM to image our folded origami due to its ability to characterise very small structures accurately (Eaton et al., 2017). We used TEM initially over other microscopy methods such as atomic force microscopy mainly due to ease of access to TEM expertise and throughput reasons. Considering we obtained good images with TEM, it made sense to not try other methods.
Mr. Jing-Bing Chen —a colleague of USYD DNA Nano Group—completed the TEM imaging for us, considering the training and expert knowledge required to operate the microscope.
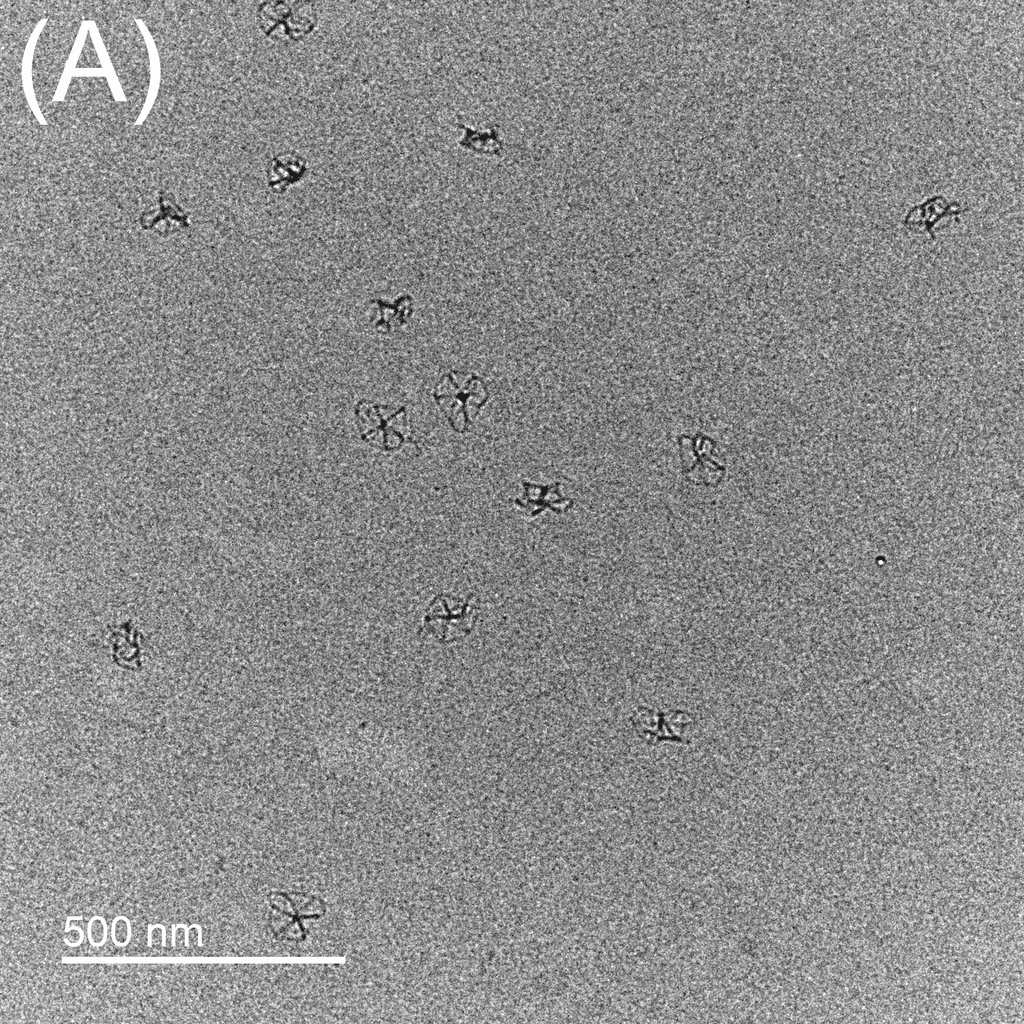
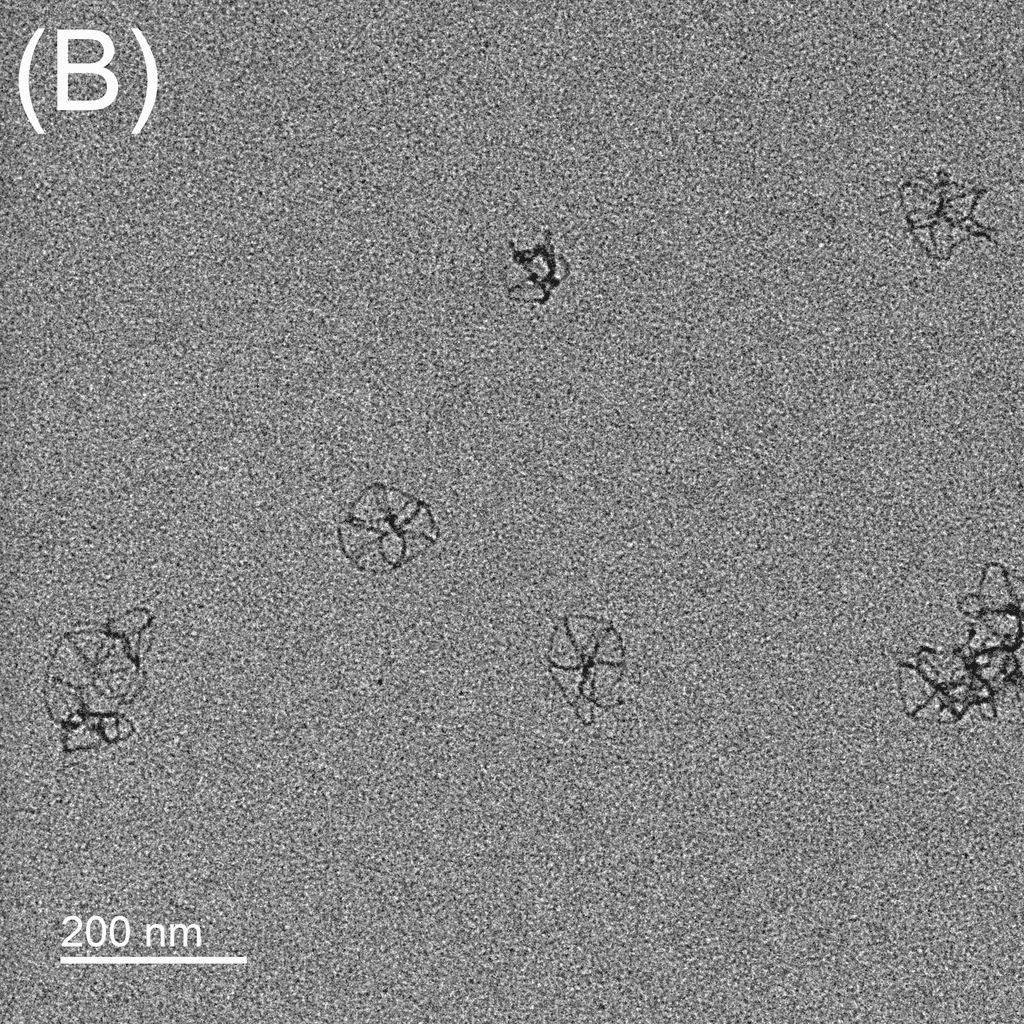
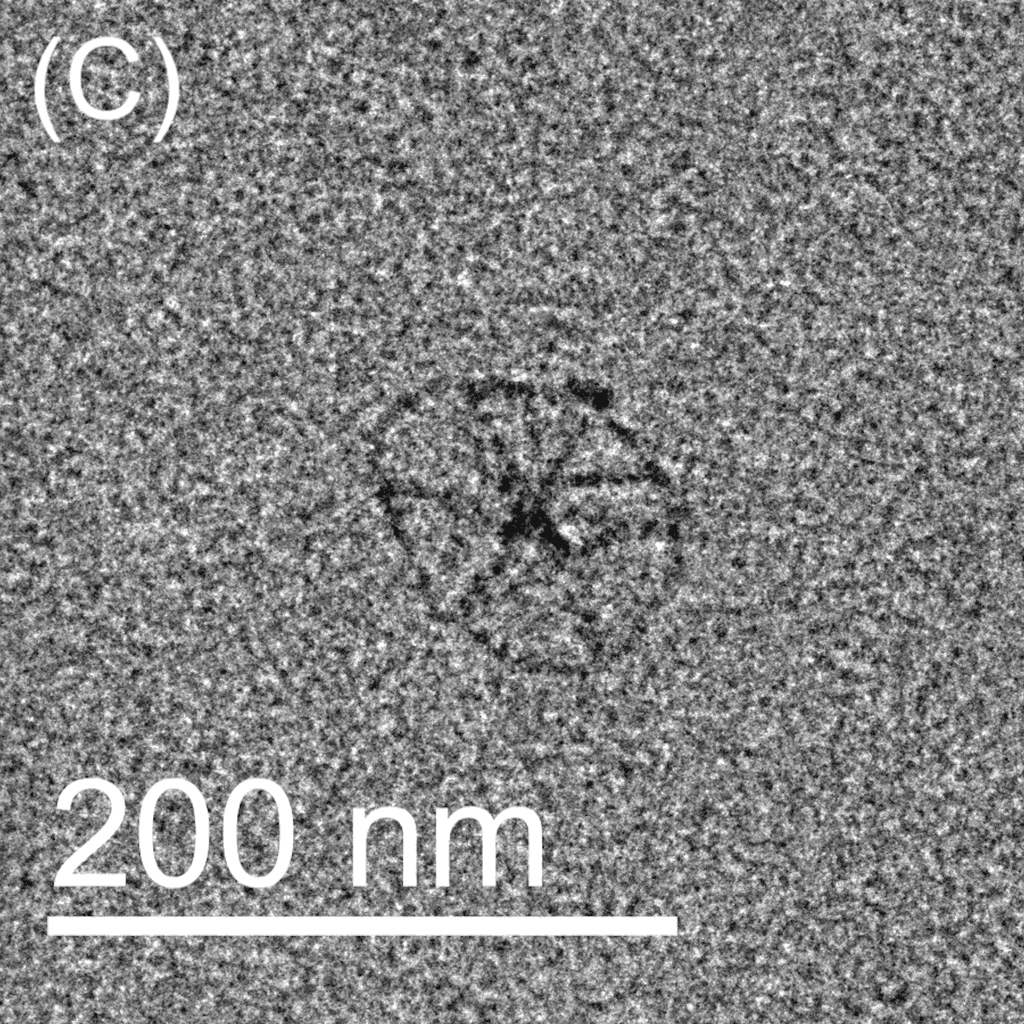
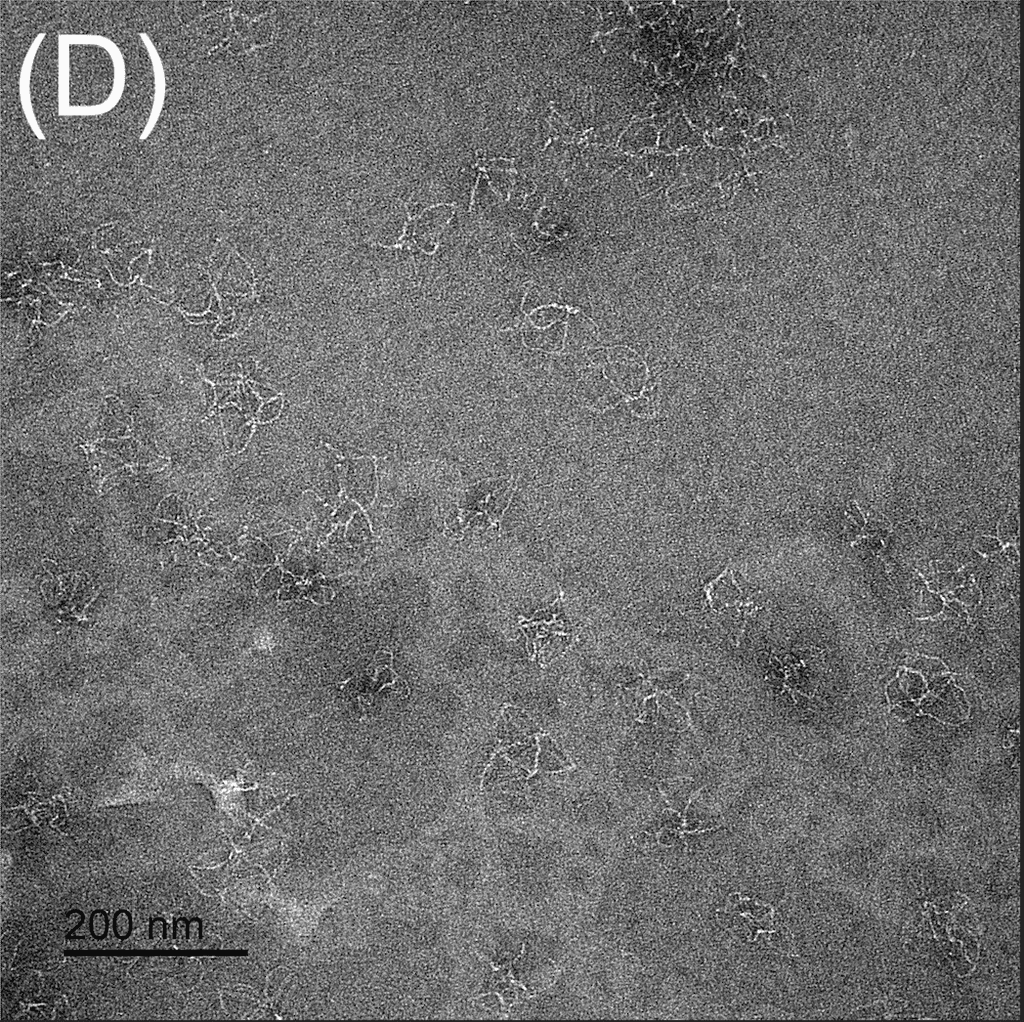
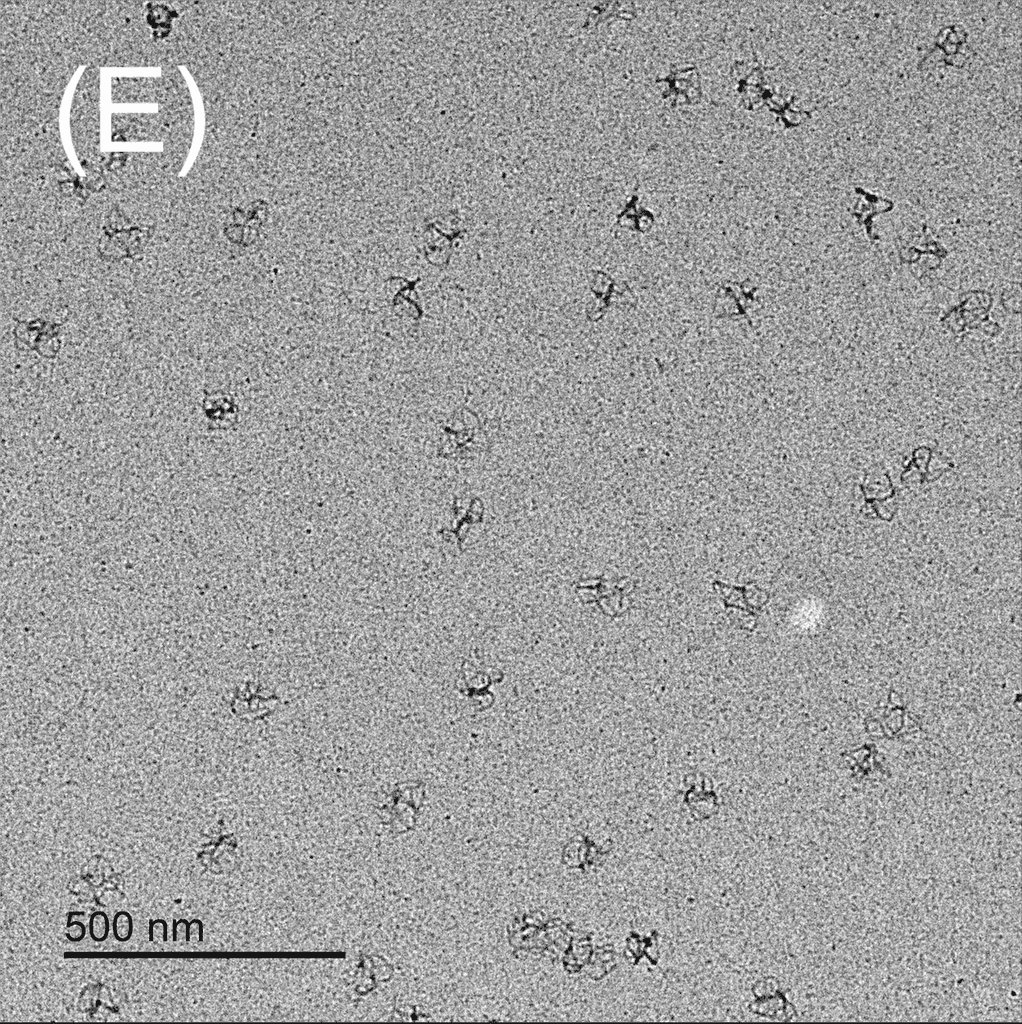
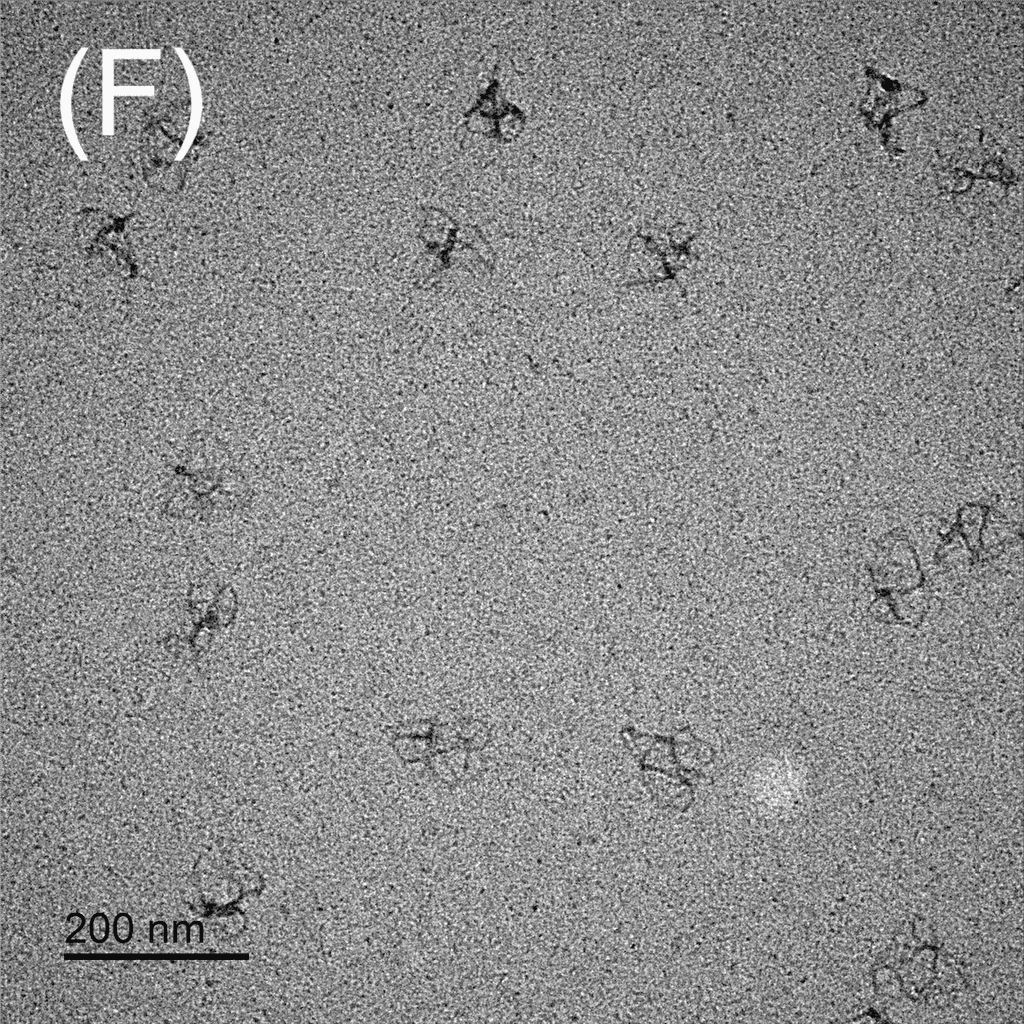
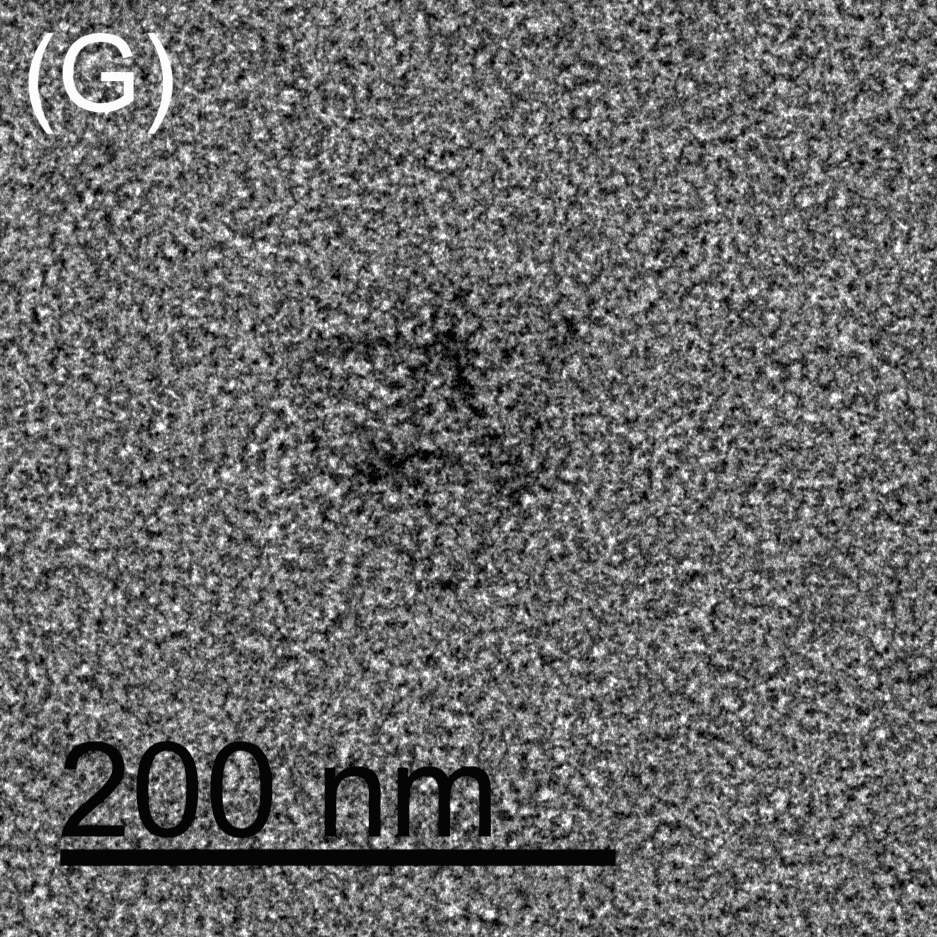
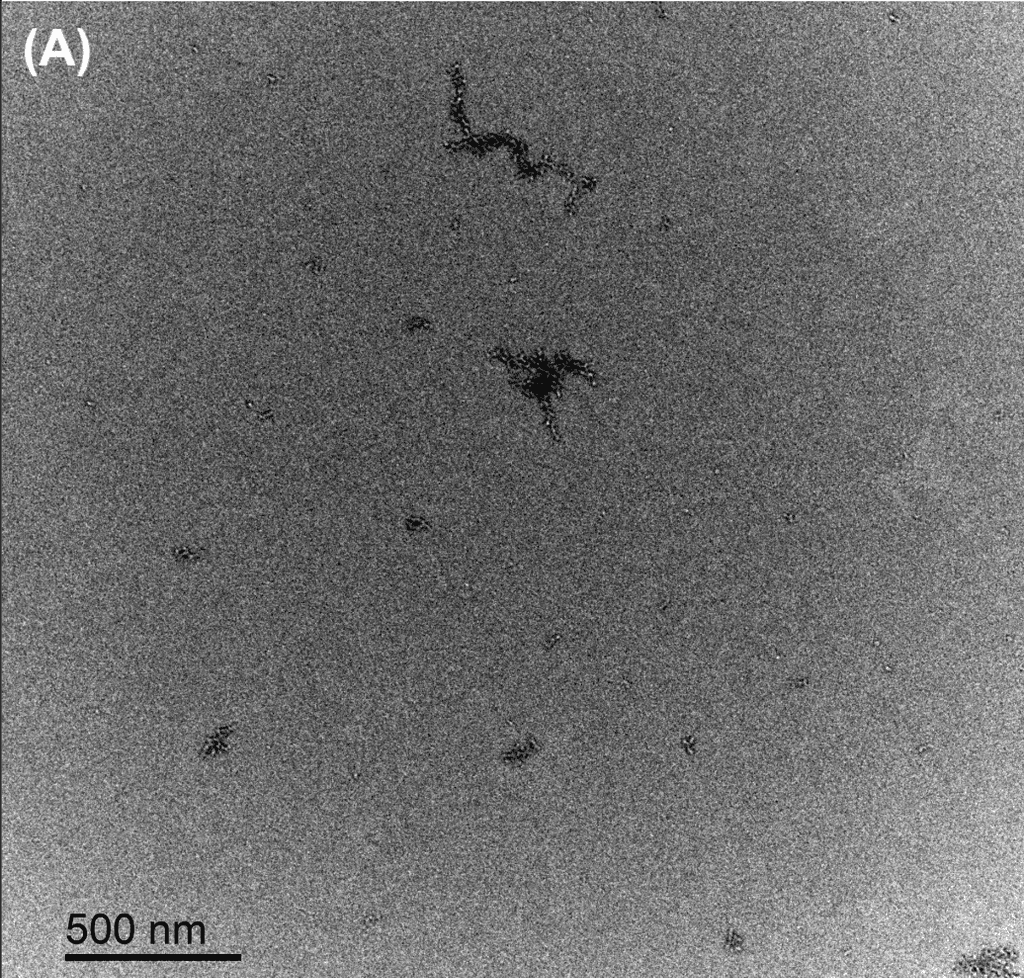
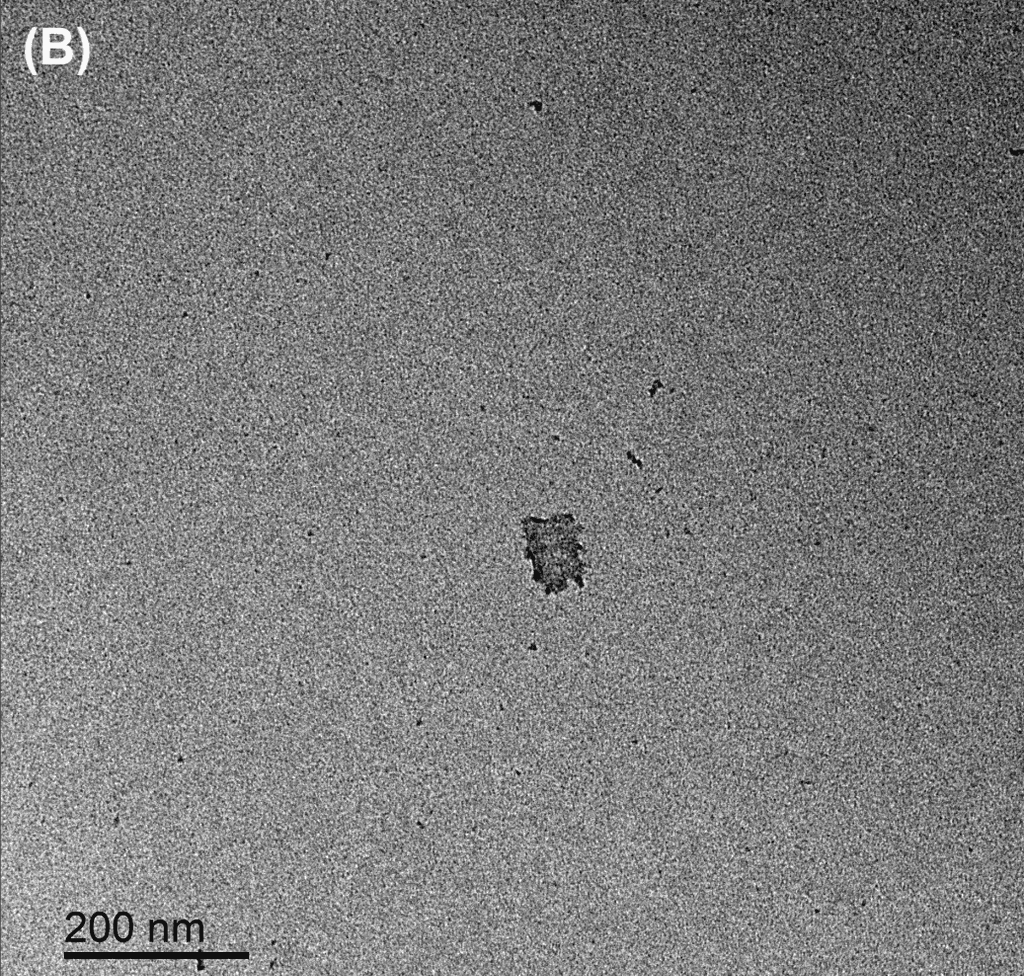
Figure 5: TEM images show the reconfiguration of the origami structure from folded open flight rings → flight rings with undefined structure → reannealed flight rings with closed configuration. The TEM model used was the FEI Tecnai T12, with a voltage set to 120kV. The resolution and magnification were set at 110kX and 120kV for 200 nm scale, and 67kX and 120kV for 500 nm scale. The flight ring samples were given a positive stain before imaging. A-C) Folded open flight rings, purified by 20% w/v PEG 8k method. D) Undefined structure, the product from strand displacement, purified by the Amicon method. E-G) Reannealed closed flight rings, purified by the Amicon method.
The TEM images show successful refolding from the synthesised open configuration → undefined configuration → reannealed closed configuration. In the original open flight rings, many origamis were folded successfully with satisfactory yield (Figure 5A-C). As the flight ring is a wireframe and essentially a 2D structure within a 4D matrix, some appear misoriented in the images, obscuring their shape, as seen in Figure 5A. Additionally, the structure’s flexibility may cause it to fold in on itself after annealing. Similarly, in the reannealed closed flight ring, the visible orientation yield is satisfactory, though some loss during refolding is expected (Figure 5E-G). Figure 5D clearly shows the flexible and “loose” nature of the undefined structure, and successful strand displacement occurred as shown by the lack of open-state flight rings.
Background
In our final design, we aim to have CpG strands attached to the connector points of the flight ring, such that as the flight ring changes shape the strands change distance between each other to be in the optimal distance zone for triggering the immune system (Zeng et al., 2024). To adapt the original flight ring design (Li et al., 2021), we need to add handles to which the CpGs can attach. Unfortunately, CpGs are essentially invisible to us—given they operate at a molecular scale with no emissions—we won’t be able to visually tell if the CpGs are attached to the flight ring or their distance from each other. Furthermore, we won’t be able to experimentally test the impact of the CpG motifs directly. As an intermediate step, we used Förster/fluorescence resonance energy transfer (FRET), replacing CpG strands with fluorophores such that we could see light emissions as the flight ring changes dynamically. Check out more details on our design for the flight ring with CpG handles here.
FRET involves the transfer of energy between two light-sensitive molecules, in our case fluorophores. In each established FRET pair of fluorophores, there is a donor and an acceptor. When the donor is within close distance of the acceptor, it will become excited and transfer its extra energy to the acceptor by raising the energy state of its electrons to a higher vibrational level. This extra energy is emitted by the acceptor as it returns to its ground state, emitting light as a byproduct (Figure 6, Energy Transfer, n.d.). Alternatively, quenching of a fluorophore works oppositely: the light emission of a fluorophore in the excited state is immediately brought into its ground state when near or in contact with its quenching fluorophore couple. Visually, this looks like the dulling or nonexistence of light emission (Figure 6, Energy Transfer, n.d.). By strategically placing donor-acceptor or fluorophore-quencher pairs on a DNA origami structure, we can see folding and reconfiguration occur in real time and measure the distances between these strands.
Figure 6: Basic FRET mechanism, retrieved from (Energy Transfer, n.d.)
We attached handles to the flight rings and hybridised quencher-fluorophore pairs to them. We aimed to peform strand displacement on the flight rings in a fluorescence spectrophotometer to measure the fluorophores movements as the origami reconfigured. Toehold-mediated DNA strand displacement as done in our prior experimental work has been proven to work with FRET mechanisms in previous studies (DW Bo Broadwater et al., 2021).
In this section of the experiment, we aimed to test 3 elements:
The flight rings with FRET handles and fluorophores attached, as predicted by our caDNAno designs.
Assess distance changes between handles when the flight rings undergo strand displacement. To achieve this, we would observe fluorophore emissions in a fluorescence spectrophotometer as the structure reconfigures.
Test different combinations of proximal and distal fluorophore distances, as a stand-in for CpG distances.
1. Origami synthesis protocol
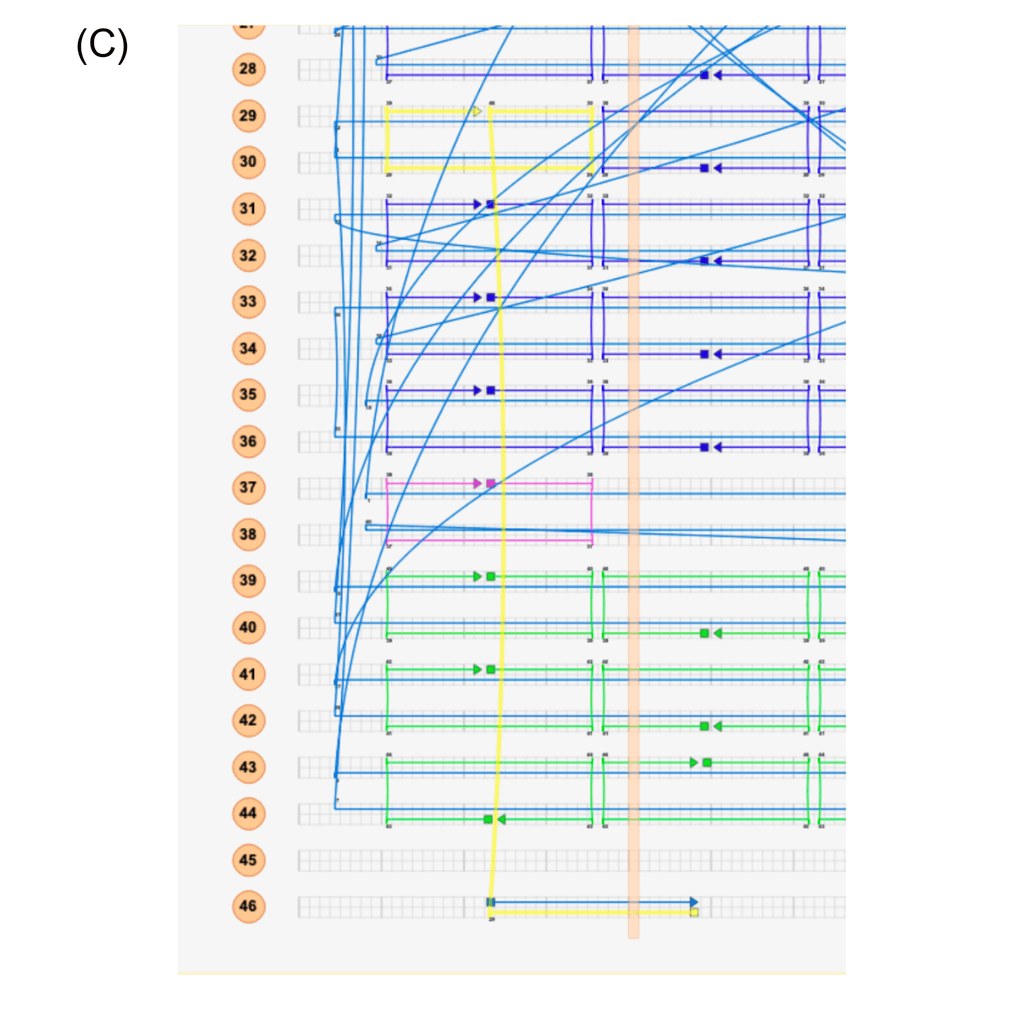
We followed essentially the same protocol as the initial flight ring experiment, making minor adjustments for adding FRET strands. Jong Hyun Choi’s lab at the School of Mechanical Engineering at Purdue University generously provided us with their caDNAno file, which we used to inform our experimental design. In caDNAno, we adjusted the flight ring design to have handles to which we could attach fluorophores, referred to by us as “FRET handles” / “fluorophore handles”. As the flight ring reconfigures from open to closed, the fluorophores will change distance from each other (Figure 7A).
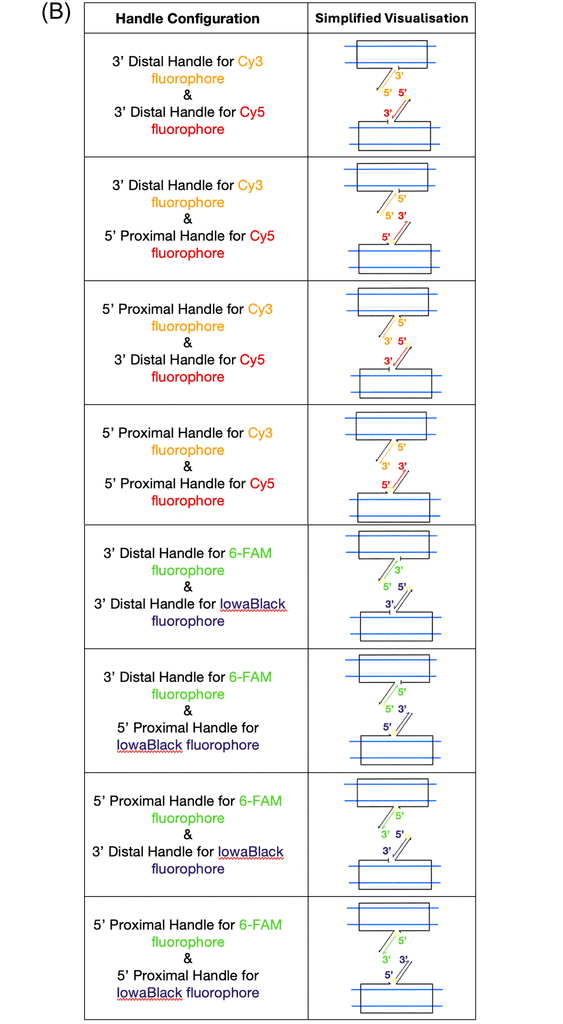
We designed the fluorophore handles to have two potential orientations, proximal or distal, which determine the positioning and rigidity of the fluorophore relative to the mobile vertex points of the flight ring structure. The orientation denoted as proximal is when the staple ssDNA is extended with the fluorophore handle sequence on its 5'-terminus, which when annealing the fluorophore-labelled ssDNA strand will rigidly lock the fluorophore directly next to the flight ring vertex. Conversely, the distal orientation is when the staple ssDNA is extended with the fluorophore handle sequence on its 3'-terminus, which when annealing the fluorophore-labelled ssDNA strand will position the fluorophore up to 6.5 nm away from the flight ring vertex (Figure 7B). Additionally, as the distal orientation positions the fluorophore at the terminus of the ssDNA staple, the fluorophore's absolute position relative to the flight ring structure will not be defined, as the free double stranded DNA (dsDNA) segment will act as a loose and mobile tether. The mobility of the tether will allow for the fluorophore to potentially be closer in proximity to its respective paired vertex point, and therefore, potentially be closer to its paired fluorophore (IowaBlack for fluorescein, and Cy5 for Cy3).
First, a new plate of oligonucleotide staples was hydrated in MilliQ water and stored as stock solutions of 200 μM in individual wells. We created new pools of oligonucleotides, based on our caDNAno designs for the staples. The new undefined configuration pool was the same as that in the previous experiment but with strands removed such that the fluorophore handle staples can attach to the scaffold. The FRET 1-8 pools (Table 6) include the fluorophore handle staples. Each handle pool will attach the fluorophores at a different combination of proximal and distal handles (Figure 7B).
Figure 7: (A) Handles will be attached to the flight rings at both ends of the jack strand, and a handle is attached, to which a fluorophore can hybridise. One half of a FRET pair will hybridise on each end of the jack strand. When the flight ring changes between open and closed states, the FRET pairs will change in distance relative to each other such that we see a quenching effect when the distance closes. (B) Combinations of fluorophores, proximal, and distal handle directions that were used for each FRET pool. The yellow circle represents where the fluorophore light emission will come from. (C) caDNAno schematic of one of the modified staples, with the 3’-terminus extension for the fluorophore handle
To assess the viability of our fluorescence handles for FRET interaction, we simulated both the opened flight ring structure and the closed flight ring structure with our modified staples in oxDNA. To do this, we imported our modified caDNAno file into oxDNA, and ran an overnight simulation for topology and trajectory, generating 200,000 frames at a timestep of 0.005. Importing the last 103,000 frames of data into oxView allowed us to keep track of the modified vertex points, and the appropriate nucleotide position of the fluorophores, we were able to predict the expected distances between fluorophores. This allowed us to determine if we wanted the fluorophore handles to have a proximal configuration (located at the 5’-terminus of the staple), a distal configuration (located at the 3’-terminus of the staple), or a combination of the two.
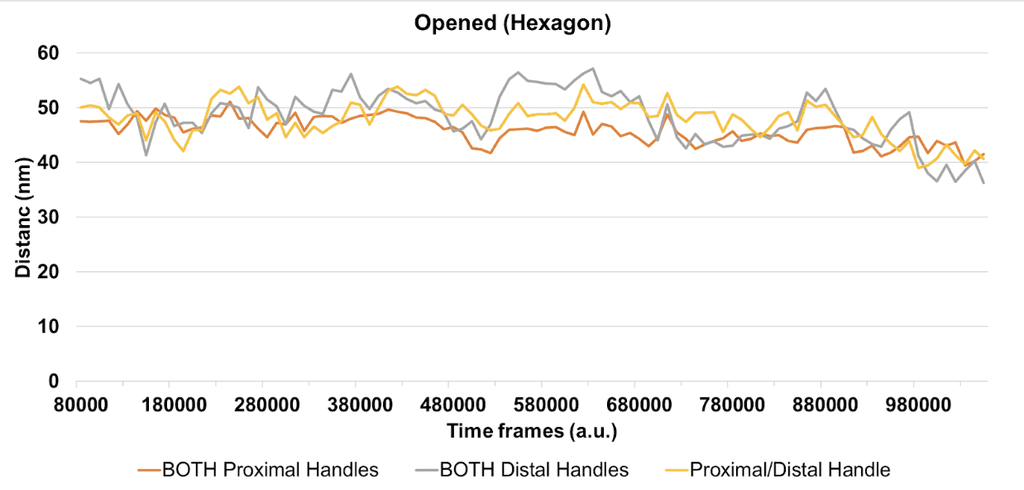
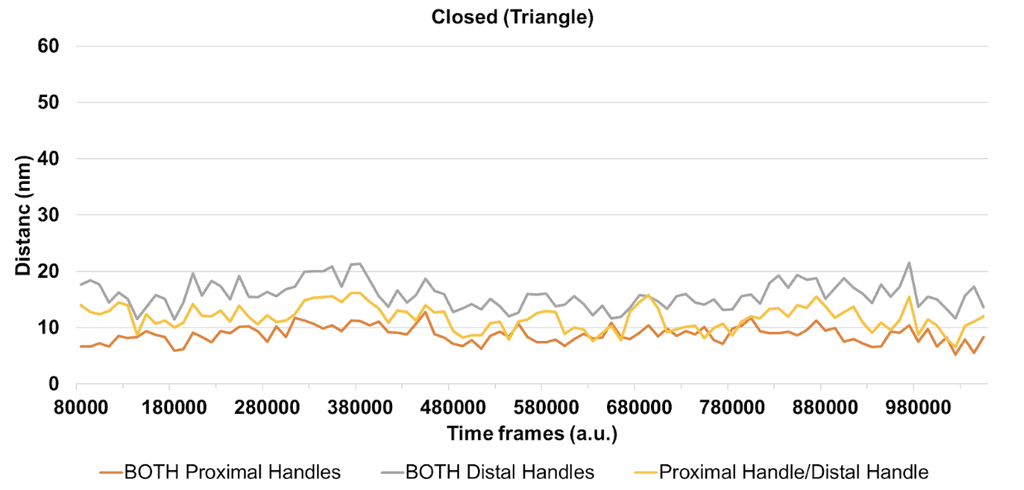
Of the combinations of fluorophore handles (i.e. proximal or distal pairing), we are most interested in both fluorophore handles being in the proximal configuration, as we suspect this will lock the fluorophores in place, and generate a less noisy FRET signal, which is confirmed by our simulations. For the closed flight ring structure, we expect the fluorophore pairs to be an average of 45.84 nm (± 2.41 nm) apart (Figure 8), and for the opened flight ring structure, we expect the fluorophores to be an average of 8.77 nm (± 1.50 nm) apart (Figure 9). According to Shrestha et al. (2015) an average distance between fluorophores of 8.77 nm would yield a FRET efficiency of 0.1, and an average distance between fluorophores of 45.84 nm would give FRET efficiency of close to 0. Therefore, when both fluorophore handles are in the proximal configuration, we should be able to distinguish the two states of the flight ring structure.
Figure 8: The line graph shows the distance (nm) between the two fluorophores that are attached to the flight ring structure in the opened state over time. The data were derived from oxDNA simulations. Each line represents a different combination of proximal and distal handles for the fluorophores.
Figure 9: The line graph shows the distance (nm) between the two fluorophores that are attached to the flight ring structure in the closed state over time. The data were derived from oxDNA simulations. Each line represents a different combination of proximal and distal handles for the fluorophores.
First, a new plate of oligonucleotide staples was hydrated in MilliQ water and stored as stock solutions of 200 μM in individual wells. We created new pools of oligonucleotides, based on our caDNAno designs for the staples. The new undefined configuration pool was the same as that in the previous experiment but with strands removed such that the fluorophore handle staples can attach to the scaffold. The FRET 1-8 pools (Table 6) include the fluorophore handle staples. Each handle pool will attach the fluorophores at a different combination of proximal and distal handles (Figure 7B).
Table 6: Pool List
Pool Name
Number of oligos
Conc. (µM)
Vol. each oligo (µL)
Total vol. oligos (µL)
H₂O µL
Final Conc. (µM)
Open Jack Strands
16
200
5
80
420
2
Closed Jack Strands
4
200
5
20
480
2
Undefined Configuration for FRET
125
200
5
625
375
1
FRET 1
8
200
5
40
460
2
FRET 2
8
200
5
40
460
2
FRET 3
8
200
5
40
460
2
FRET 4
8
200
5
40
460
2
FRET 5
8
200
5
40
460
2
FRET 6
8
200
5
40
460
2
FRET 7
8
200
5
40
460
2
FRET 8
8
200
5
40
460
2
We assembled the flight ring in both the open and closed states. 5 nM of an M13mp18 scaffold strand (also referred to as p7249) was mixed with a 4-fold relative concentration of DNA staples in folding buffer (FB contains 1x TE buffer + 6 mM MgCl₂) (Table 7). For the closed state, the undefined staples pool & the closed jack strands pool were added, and for the open state, the undefined staples pool & the open jack strands pool were added. Additionally, one of the eight FRET Handles pools was added to each open and closed state configuration (Table 8), at a 4-fold relative concentration of DNA staples (Table 7). The FRET fluorophore pair appropriate for the used FRET handle pool was added at a 10-fold relative concentration of DNA staples (Table 7) to account for uneven concentrations of staples in the pools from the hydration process; we wanted to ensure that all successfully annealed flight rings would have a fluorophore attached.
The mixture was annealed in a thermocycler following this cycle:
annealed from 95 to 65 °C at −1 °C per 2 min;
from 65 to 60 °C at −1 °C per 25 min;
from 60 to 50 °C at −1 °C per 60 min;
from 50 to 45 °C at −1 °C per 25 min;
from 45 to 25 °C at −1 °C per 2 min;
and finally, held at 4 °C.
Table 7: Mixture for annealing the flight ring. We made 16 flight rings total: 8 with the Open Jack Strand Pool and 8 with the Closed Jack Strand Pool. A different FRET Pair Handle Strand was attached to each flight ring, corresponding to the fluorophore pair added.
Flight ring
Final conc. (nM)
Initial conc. (nM)
Vol. (µL)
Scaffold 7249
5
500
1.2
Open Jack Strand or Closed Jack Strand Pool
20
2000
1.2
Undefined Configuration for FRET Pool
20
1000
2.4
FRET Handle 1-8 Pools (one at a time)
20
2000
1.2
Fluorophores Cy3/Cy5 or FAM/IowaBlack
50
4000
1.5
FB
6,000,000
60,000,000
12
H₂O
-
-
100.5
Total Volume
-
-
120
Table 8: Visualisation of what is in each annealed flight ring mixture (Both scaffold 7249 and undefined configuration for FRET pool are in each mixture).
Closed 1
Closed 2
Closed 3
Closed 4
Closed 5
Closed 6
Closed 7
Closed 8
Open 1
Open 2
Open 3
Open 4
Open 5
Open 6
Open 7
Open 8
Undefined
Open Jack Strands
✓
✓
✓
✓
✓
✓
✓
✓
✗
✗
✗
✗
✗
✗
✗
✗
✗
Closed Jack Strands
✗
✗
✗
✗
✗
✗
✗
✗
✓
✓
✓
✓
✓
✓
✓
✓
✗
FRET Pair Handles 1
✓
✗
✗
✗
✗
✗
✗
✗
✓
✗
✗
✗
✗
✗
✗
✗
✗
FRET Pair Handles 2
✗
✓
✗
✗
✗
✗
✗
✗
✗
✓
✗
✗
✗
✗
✗
✗
✗
FRET Pair Handles 3
✗
✗
✓
✗
✗
✗
✗
✗
✗
✗
✓
✗
✗
✗
✗
✗
✗
FRET Pair Handles 4
✗
✗
✗
✓
✗
✗
✗
✗
✗
✗
✗
✓
✗
✗
✗
✗
✗
FRET Pair Handles 5
✗
✗
✗
✗
✓
✗
✗
✗
✗
✗
✗
✗
✓
✗
✗
✗
✗
FRET Pair Handles 6
✗
✗
✗
✗
✗
✓
✗
✗
✗
✗
✗
✗
✗
✓
✗
✗
✗
FRET Pair Handles 7
✗
✗
✗
✗
✗
✗
✓
✗
✗
✗
✗
✗
✗
✗
✓
✗
✗
FRET Pair Handles 8
✗
✗
✗
✗
✗
✗
✗
✓
✗
✗
✗
✗
✗
✗
✗
✓
✓
Fluorophores Cy3/Cy5
✓
✓
✓
✓
✗
✗
✗
✗
✓
✓
✓
✓
✗
✗
✗
✗
✗
Fluorophores FAM/IowaBlack
✗
✗
✗
✗
✓
✓
✓
✓
✗
✗
✗
✗
✓
✓
✓
✓
✓
2. Testing reannealing the flight ring from the undefined state
We wanted to confirm that the flight ring could also go from an undefined state to a closed or open configuration with fluorophores attached. To do this, we annealed an undefined state flight ring (no jack strands) with FRET Pair Handle 8 and Fluorophores MST0062 + MST0063, as this combination had a proximal/proximal handle combination, which should put the fluorophores furthest away from each other (Table 8, Figure 7). We hypothesised this would work best.
To test the reannealing of an undefined flight ring, we first used Amicon purification to purify the undefined flight rings in preparation for adding jack strands. We used Amicon purification as opposed to PEG purification for this due to time constraints and because we obtained adequate yield in the previous experiment for this method (Figure 5D-G). We then annealed the flight ring using the same mixture as the initial methodology in Step 3, using the closed jack strands pool to lock the flight ring into the closed configuration (Table 4).
3. Confirming annealing using agarose gel electrophoresis
We used AGE to confirm that the flight rings were successfully annealed with FRET handles and fluorophores attached before continuing to do strand displacement. We added the undefined → closed state samples to the AGE (Figure 8A) to test if the flight ring was successfully reconfigured.
Considering we used quenching fluorophores (Figure 6), we should see a “dimming” of the bands if the fluorophores are closer together based on the distance given by the proximal and distal FRET handles. So, we hypothesised that the bands should be dimmer in samples that used FRET 1 compared to FRET 4 handles and FRET 5 compared to FRET 8 handles (Figure 7).
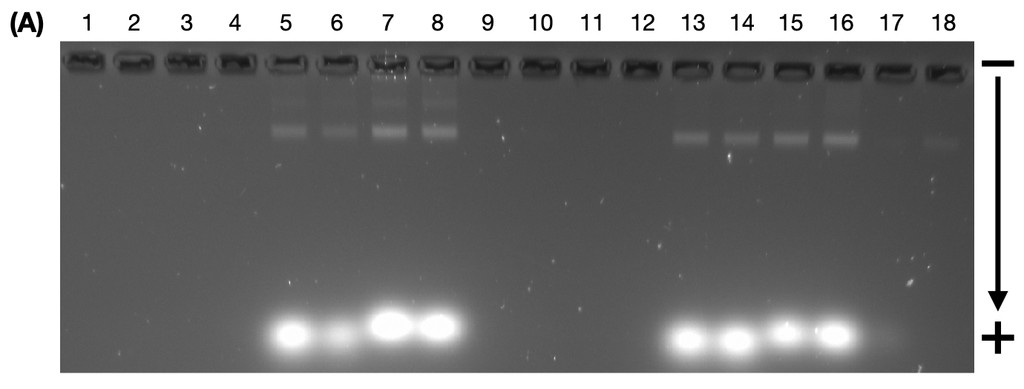
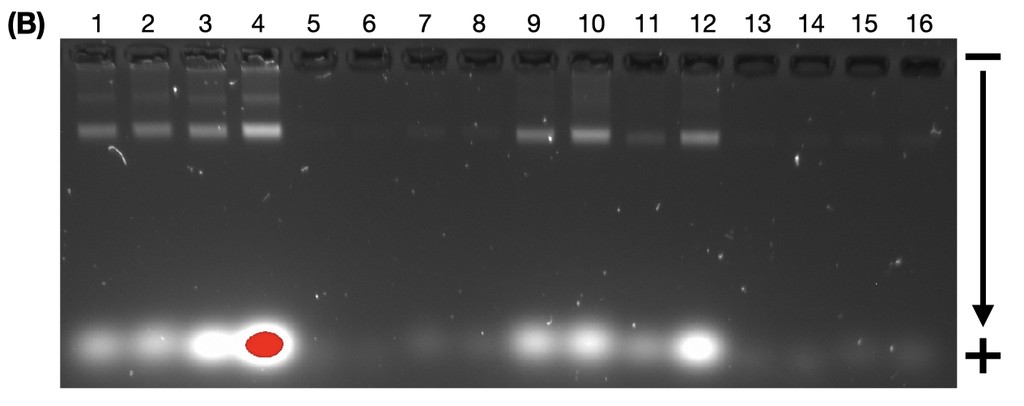
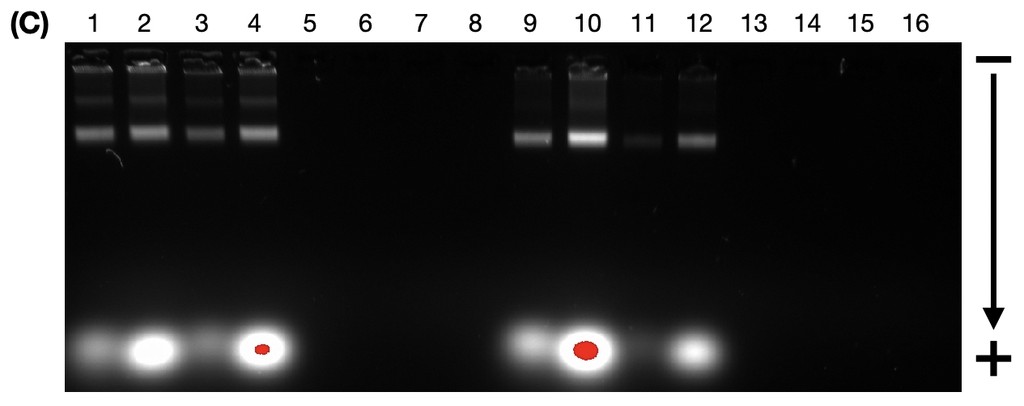
Figure 10. Agarose gel electrophoresis (2% agarose, 0.5X TAE buffer) ran at 60V for 4 hours. Gel images are from the (A) fluorescein channel; (B) Cy3 channel; and, (C) Cy5 channel.
Lane 1: Open 1, Lane 2: Open 2, Lane 3: Open 3, Lane 4: Open 4, Lane 5: Open 5, Lane 6: Open 6, Lane 7: Open 7, Lane 8: Open 8, Lane 9: Closed 1, Lane 10: Closed 2, Lane 11: Closed 3, Lane 12: Closed 4, Lane 13: Closed 5, Lane 14: Closed 6, Lane 15: Closed 7, Lane 16: Closed 8, Lane 17: undefined state flight ring with attached fluorophores, Lane 18: closed state flight ring annealed from undefined state (Table 8).
From the gel (Figure 10), we can see that the FRET handles and fluorophores were successfully annealed with the flight rings. The open structures have travelled a shorter distance than the closed structures, indicating they are heavier products and are in the expected relative position. As expected, in the fluorescein channel (Figure 10A), you can see only the flight rings that used the FAM and IowaBlack fluorophore pairs, and in the Cy3 and Cy5 channels (Figure 10B & 10C), you can only see the flight rings that used the Cy3 and Cy5 fluorophore pairs.
There are two distinct bands visible in the open-state wells. The brighter band (bottom) is the annealed flight rings, whereas the top band is more likely to be aggregated scaffolds annealed together by the extra products. The faint band could include any combination of high-concentration scaffold, staples and fluorophores, including dimer and crosslinked structures. For the closed flight rings, this second band is more blurred (Figure 8C, Lane 10), which could point to a wider variety of intermediate and hybrid structures. These are often seen as a byproduct in unsolid products like our wireframe origami, and are more readily picked up in the Cy5 channel due to the channel's sensitivity to noise. Hence, this second band may have been present in the previous experiments’ gels, but was invisible in the image based on the use of SyBr Safe and different filters for the gels without fluorophores.
We expected to see variation in the brightness/dullness of the bands in the different channels as the varied distance between fluorophores influences the resonance between FRET-paired molecules. Cy3/Cy5 are a classic FRET pair, when Cy3 is near Cy5, we expect the band to be brighter in the Cy5 channel and dimmer in the Cy3 channel as Cy3 will “transfer” its energy to Cy5, causing it to emit light (Figure 6). Conversely, when Cy3 and Cy5 are apart, we expect the band to be brighter in the Cy3 channel and dimmer in the Cy5 channel. 6-FAM/IowaBlack is a quencher-fluorescent FRET pair; the brightness of the 6-FAM dye diminishes as the IowaBlack quencher comes closer (Figure 6). So in the fluorescein channel, we expect to see brighter bands when the FRET handles are further apart. There did not appear to be sufficient variation in the intensity/brightness of the bands, indicating that the fluorophores may not be close enough in the closed state to enable resonance between the FRET-paired molecules.
We cannot see any product for the undefined and reannealed closed states (Figure 10A, Lanes 17 & 18), as evident by the absent band where the DNA origami should be. Considering the other open and closed structures annealed successfully, the reasoning behind this requires further investigation. Potential reasons could be that the flight ring needs to be closed open to anneal the handles or that the fluorophores are interacting unexpectedly. Alternatively, origami interference could cause interference with the FRET mechanism.
4. Purification + Nanodrop Results
The DNA origami has to be devoid of excess staples in order to be analysed by fluorescence spectroscopy, otherwise additional fluorophores will give false results. Based on the initial flight ring experiment, we decided to purify the annealed flight rings thrice using our 20% w/v PEG 8k purification method.
The DNA origami was mixed 1:1 with a PEG precipitation buffer (20% w/v PEG8k, 5 mM Tris, 1 mM EDTA, 505 mM NaCl). The solution was centrifuged at 16,000 g at room temperature for 25 minutes. We removed the supernatant carefully with a pipette, ensuring we didn’t disrupt the pellet. We resuspended the pellet in 1xFB and put it in the thermoshaker for 1.5 hours at 30 ºC, 1000 rpm. The solution was once again mixed 1:1 with the PEG precipitation buffer and then put into the centrifuge under the original conditions for a second run. Again, we removed only the supernatant. The pellet was then resuspended in 1xFB and put in the thermoshaker for 2 hrs at 30 ºC, 1000 rpm. For the final purification, the solution was mixed 1:1 with the PEG precipitation buffer and then put into the centrifuge under the original conditions for a second run. We removed only the supernatant. The pellet was then dissolved in 1xFB in 15 uL and put in the thermoshaker for 3 hrs at 30 ºC, 1000 rpm.
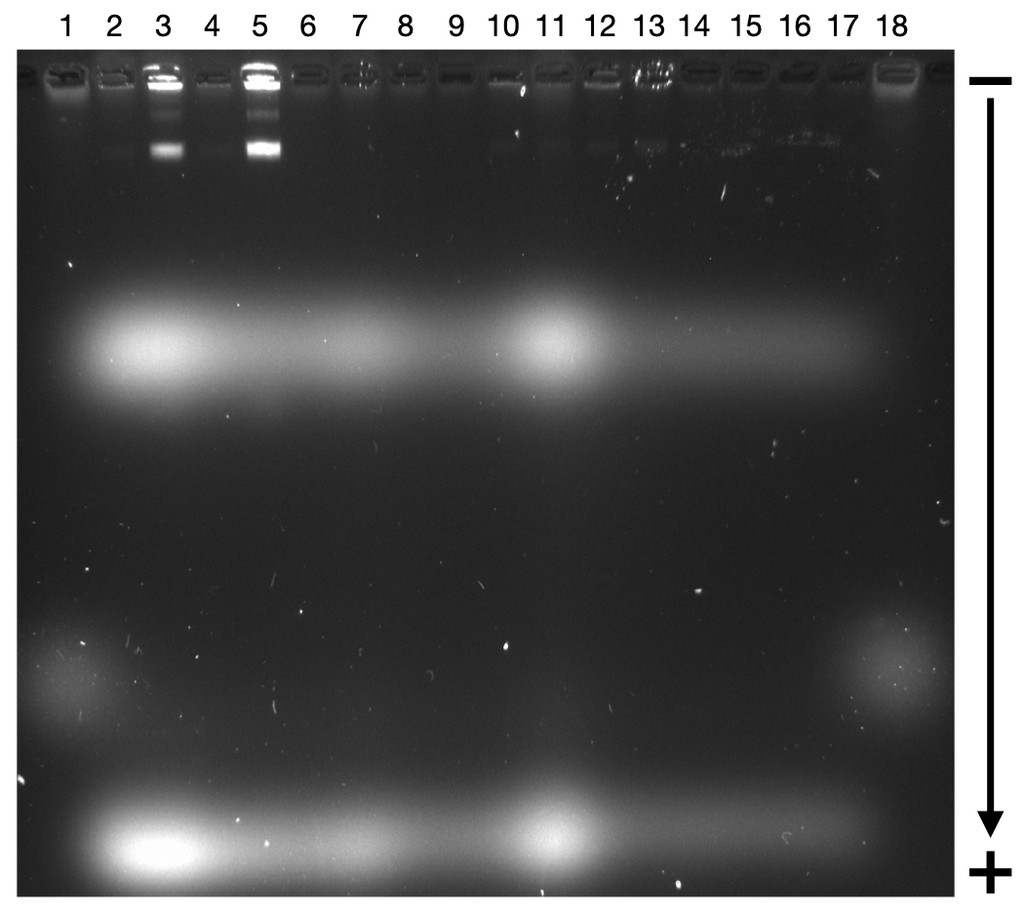
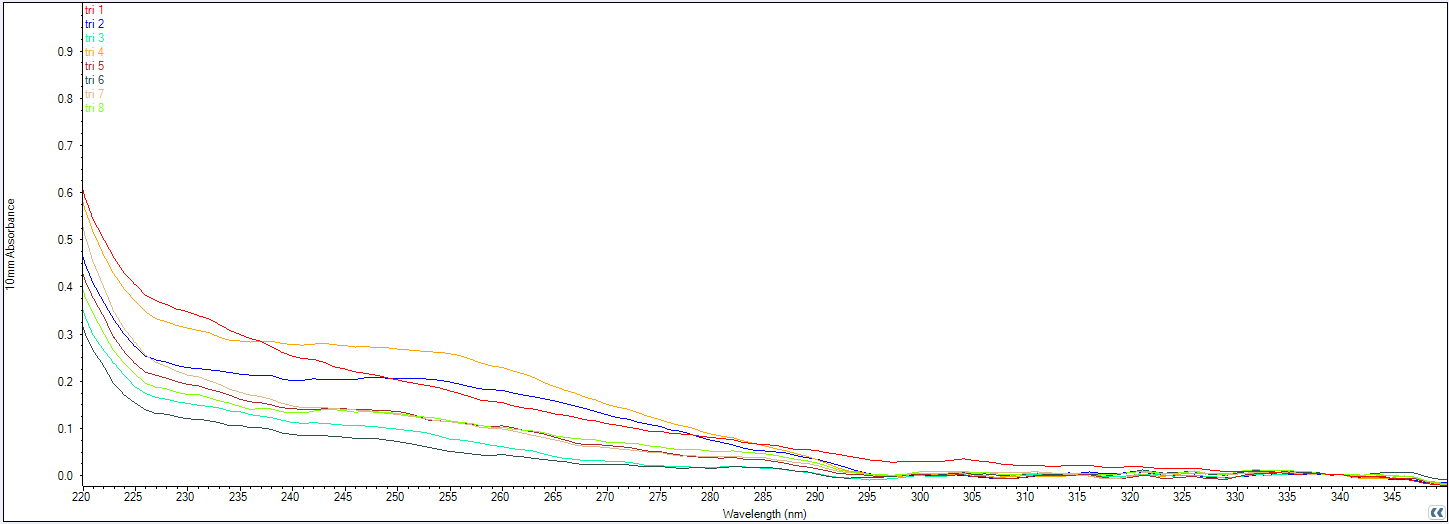
We used the Nanodrop spectrophotometer to check if the flight rings were successfully purified, and if we had enough available DNA origami to use within the plate reader for kinetic measurement of strand displacement (Table 9), noting we would need between 3 and 5 nM at minimum for sufficient signal above background noise. Unfortunately, none of our purified flight ring solutions was sufficiently concentrated enough to continue testing the fluorophore distances through strand displacement using the plate reader. We instead used AGE to confirm if there was any DNA content following PEG purification (Figure 11).
Figure 11. Agarose gel electrophoresis (2% agarose, 0.5X TAE buffer) run at 60V for 4 hours, image taken using the Cy5 channel. Lane 1: size standard (1 kbp ladder), Lane 2: Closed 1, Lane 3: Closed 2, Lane 4: Closed 3, Lane 5: Closed 4, Lane 6: Closed 5, Lane 7: Closed 6, Lane 8: Closed 7, Lane 9: Closed 8, Lane 10: Open 1, Lane 11: Open 2, Lane 12: Open 3, Lane 13: Open 4, Lane 14: Open 5, Lane 15: Open 6, Lane 16: Open 7, Lane 17: Open 8, Lane 18: size standard (1 kbp ladder).
Table 9: Concentration of annealed origami and fluorophore structures following PEG purification
Sample
Est C (ng/uL)
Est C (nM)
Open 1
3.6
0.81
Open 2
1.9
0.43
Open 3
3.4
0.77
Open 4
2.6
0.59
Open 5
4.3
0.97
Open 6
3.5
0.79
Open 7
5.7
1.28
Open 8
5.6
1.26
Closed 1
7.7
1.79
Closed 2
9
2.1
Closed 3
3
0.7
Closed 4
11.4
2.65
Closed 5
5.2
1.21
Closed 6
2.1
0.49
Closed 7
4.8
1.12
Closed 8
5
1.16
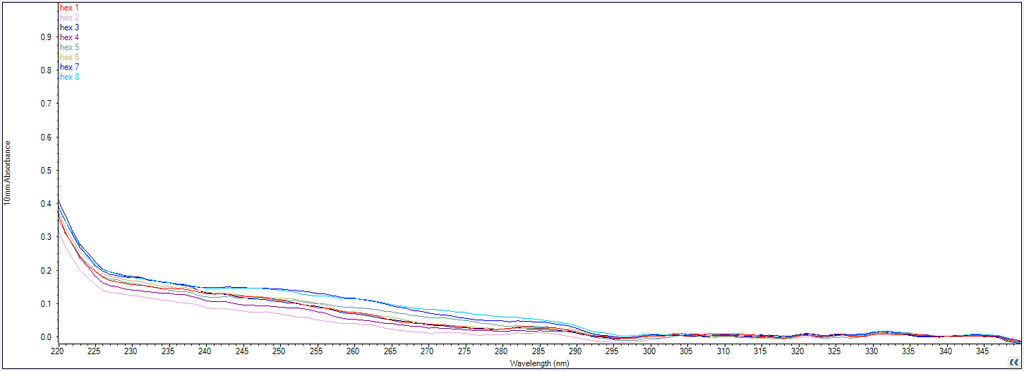
Figure 12: Trace of wavelength (nm) absorbance of the purified DNA origami samples, measured by the NanoDrop Spectrophotometer.

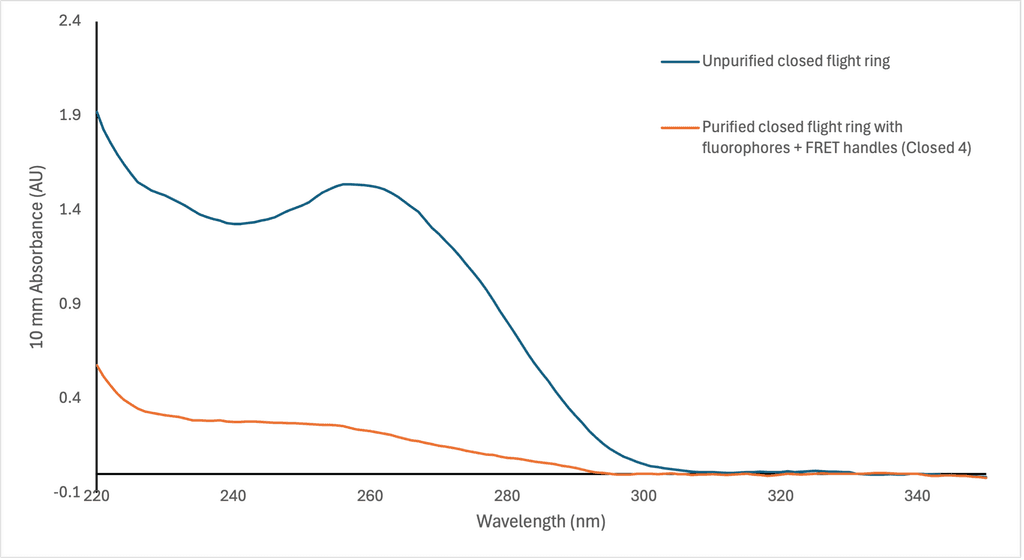
Figure 13: Comparison of wavelength (nm) absorbance between unpurified open and closed flight rings without the fluorophores handles attached and purified flight rings with fluorophore handles, measured by the NanoDrop spectrophotometer.
In Figure 12, we can see that there is not much absorbance at 260 nm, which is the typical wavelength that nucleic acids absorb. Compared to the flight rings annealed without handles before purification (Figure 13), there is a significant difference in absorption between samples with successfully annealed flight rings and those without. As a result, it seemed unlikely that there was any DNA origami in the solutions following PEG precipitation. This is supported by the AGE gel (Figure 11), which had non-existent or faint DNA bands for most of the flight rings. The Closed 2 and Closed 4 purified flight rings had the highest concentration, 2.10 & 2.65 nM respectively (Table 9), which is consistent with the gel as they are the two most visible bands (Figure 11, lanes 3 & 5). As we know the flight rings were most likely annealed (Figure 10), and we can conclude the PEG precipitation was likely unsuccessful.
Sectional summary
From the AGE of the flight rings before purification (Figure 8), we can confirm that the flight rings were successfully annealed with the FRET handles and fluorophores attached. However, because we were unable to proceed with strand displacement due to time constraints around optimising purification, further investigation is still required for the distance between fluorophores during reconfiguration, and the effect of proximal and distal FRET handles.
Further investigation is required to be able to understand the interaction between PEG and wireframe origami. Our methods came from 2D solid tiles and 3D hollow barrels, though PEG purification relies a lot more heavily on thermodynamic characteristics compared to other purification methods like the Amicon filtration. More trialling of PEG precipitation methods and purifying wireframe DNA origami structures in general is needed. Potential other methods of purification could be trialled such as desalting (Jun et al., 2019) or sequential pull-down purification (Ye et al., 2021).
Background
Our team is serious about getting the HubbleBubble device to work effectively in the human body someday. So naturally, the biostability of our DNA origami is a top priority to be explored now. The main barriers to DNA nanostructures being viable in vitro are degradation by nucleases, and denaturation induced by unstable low Mg²⁺ and salt concentrations, found in the body (Anastassacos et al., 2020; Ponnuswamy et al., 2017; Singh et al., 2022)). There is substantial evidence to suggest coating DNA nanostructures in an oligolysine coating helps to protect against degradation and denaturation, stabilising structures for longer in vitro. Oligolysine is a polymer of the amino acid lysine, which forms a strong complex that “glues” onto DNA structures through electrostatic interaction (Anastassacos et al., 2020). While the oligolysine facilitates interaction with DNA phosphates, which modestly protects nanostructures from nuclease degradation, conjugating oligolysine coatings with PEG further blocks nuclease attacks and significantly reduces degradation ((Anastassacos et al., 2020; Ponnuswamy et al., 2017; Singh et al., 2022)). This coating has been identified as non-toxic, and PEG is generally thought to have little immunoreactivity (Anastassacos et al., 2020). A few studies suggest an increase in biocompatibility and biostability. For example, Ponnuswamy et al. (2017) found that “oligolysine-PEG-stabilised DNA nanostructures survive uptake into endosomal compartments and, in a mouse model, exhibit a modest increase in pharmacokinetic bioavailability”. Additionally, Zeng et al. (2024) deemed an oligolysine-PEG coated DNA-origami-based vaccine with CpG adjuvant as safe and effective. This suggests that using an oligolysine-PEG coating on our flight ring with CpGs attached could increase its biostability in vitro.
We have some preliminary research on the efficacy of using oligolysine-PEG coatings on DNA origami structures. As a first step, we coated some reliable DNA origami tiles and barrels provided to us by our colleagues in the USYD DNA Nano group. After coating these nanostructures in oligolysine-PEG coating based on Ponnuswamy et al. (2017), we diluted them in either MilliQ water, DNAse I, or folding buffer (FB contains 1x TE,12 mM MgCl₂) as a stability test. These samples were then imaged by TEM (Figure 12).
Materials and methodology
Oligo pools were mixed and annealed for either 3 hours or 18 hours to make DNA origami tile or barrel using standard protocols provided by USYD DNA Group, respectively. 15% w/v PEG8k purification following the same step described in recreating flight rings step 4, method 2 was conducted afterwards for 2 runs. The concentration of purified origami was measured by a Nanodrop spectrometer, giving 17.4 nM for tile and 42.8 nM for barrel.
DNA origami structures were diluted to 10 nM using folding buffer (12 mM MgCl₂), and oligolysine (5k) was prepared to a 50 µM stock in MilliQ water with 30 minutes of sonication. The DNA origami structures and oligolysine were then mixed to have the individual amine groups in the oligolysine be at the same concentration as the individual phosphate groups in the DNA origami. The mixtures were left to incubate at room temperature for 30 minutes. Following incubation, the oligolysine-coated DNA origami was diluted in either MilliQ water, DNase I, or FB (12 mM MgCl₂), and left for 14 days at 4 °C. Additionally, uncoated DNA origami were prepared to the same final concentration with the same diluents as the oligolysine-coated DNA origami, for control samples. Samples were imaged after the 14 day period via TEM.
TEM Images
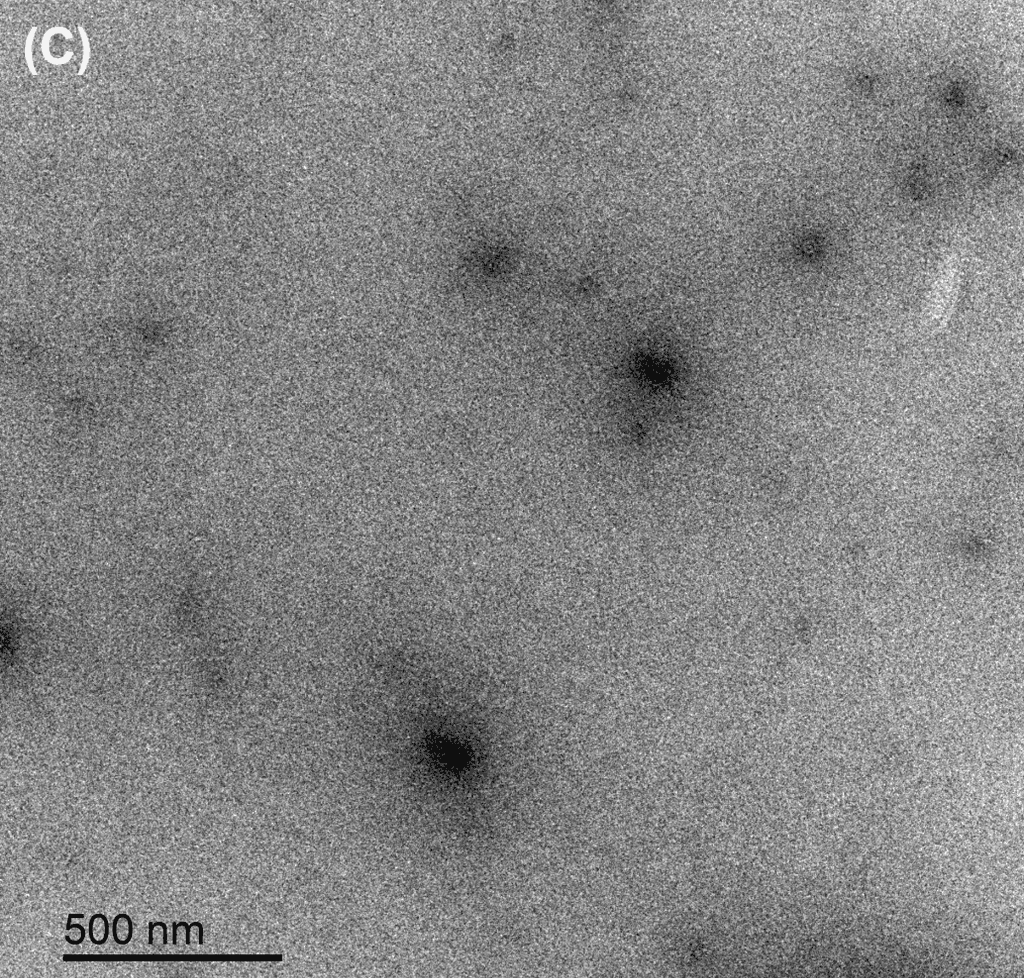
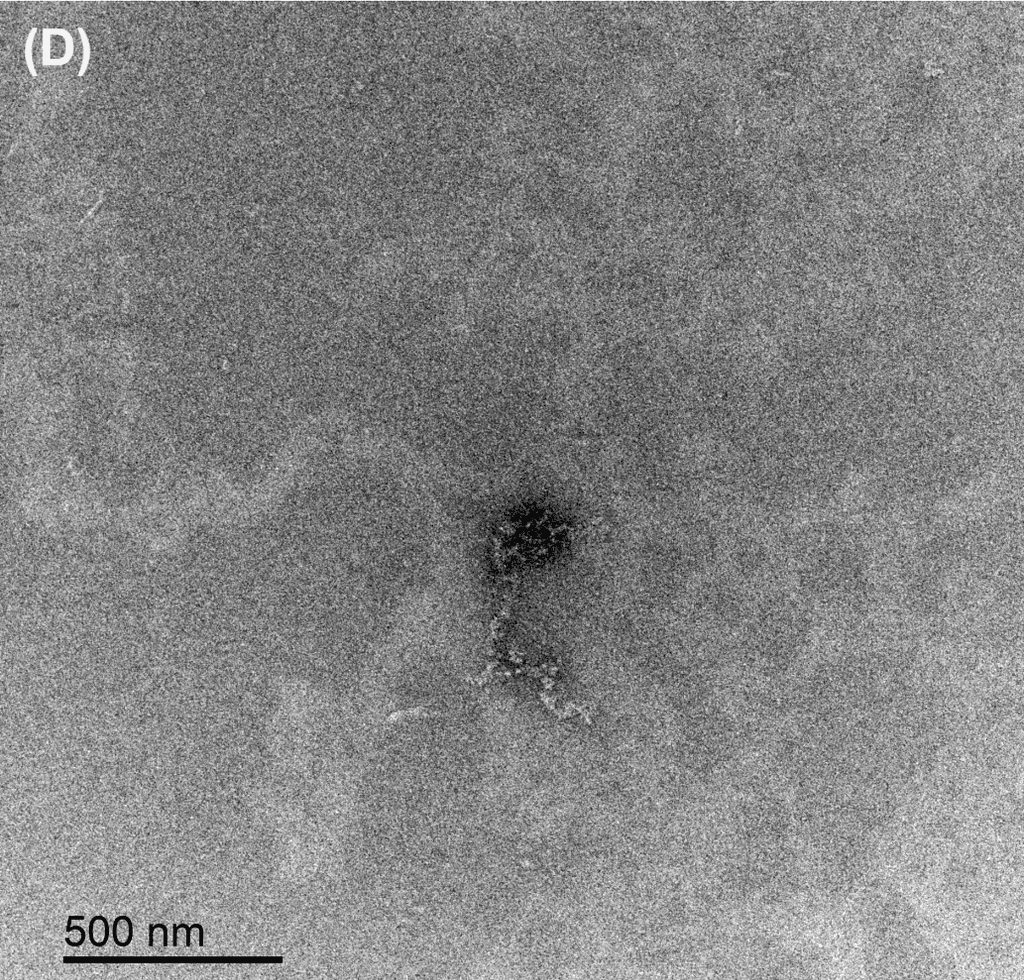
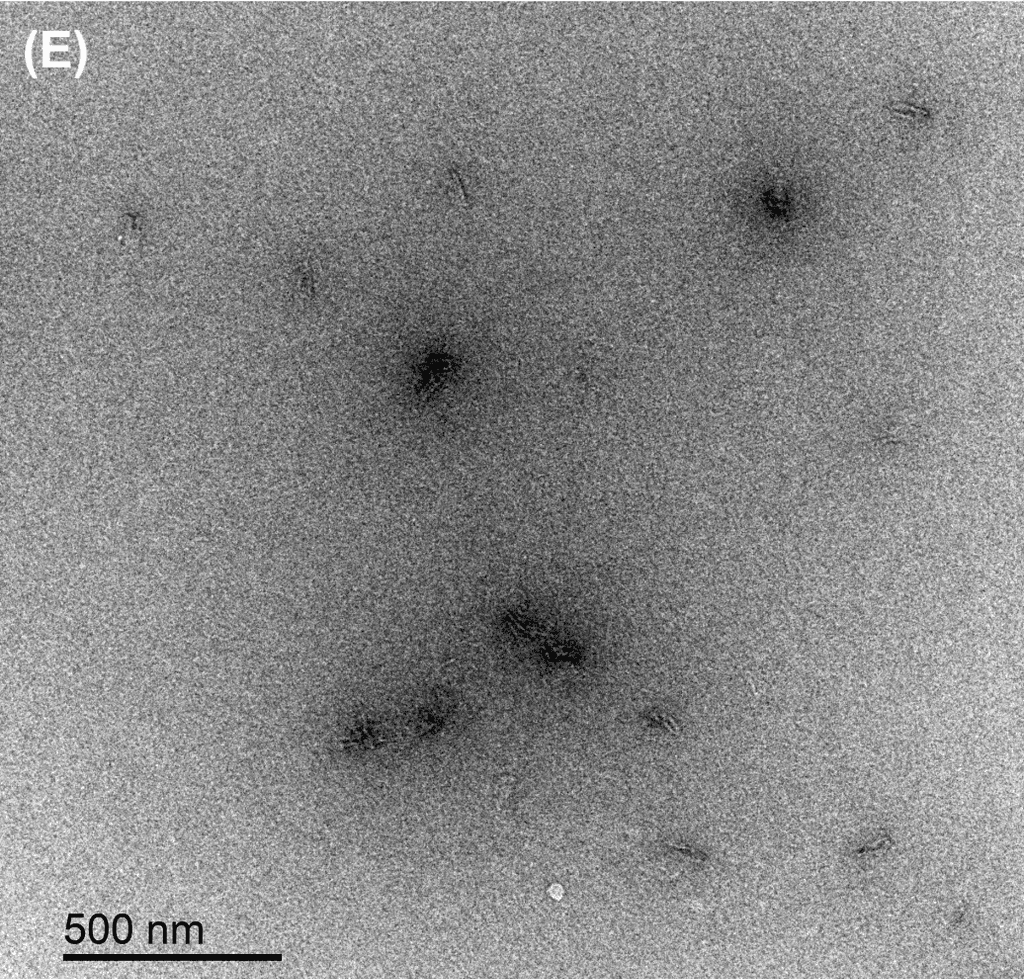
Figure 12. TEM Images of the DNA tile and barrel nanostructures diluted in different media. The TEM grid was discharged to make it attract negative tiles, and the structures were stained with uranium acetate before imaging. The coated and uncoated tiles in FB (12 mM MgCl₂) had no particle in view. (A) Tile in DNAse I. (B) Tile in MilliQ water. (C) Oligolysine-coated tile in DNAse I. (D) Oligolysine-coated tile in MilliQ water. (E) Oligolysine-coated barrel in MilliQ water.
Both oligolysine-coated and uncoated tiles were degraded by DNAse I, though the uncoated tile remained intact in MilliQ water, and it is unclear if the oligolysine-coated tile remained intact following dilution in MilliQ water. The oligolysine-coated barrel degraded in MilliQ water as well. The structures diluted in the folding buffer were not fully visible under TEM.
Sectional Summary
Based on the TEM images, our oligolysine-PEG coating conditions require further investigation before we can attempt coating our flight rings. As there is no available research on coating wireframe DNA origami with oligolysine, extensive optimisation is required to continue. One experimental consideration of coating the flight rings in the future is that we potentially would not see small pieces of degradation in images due to the 2D nature of images in comparison to the extreme flexibility of a wireframe structure.
Another major consideration of completing further oligolysine-coating experiments alongside our flight ring development is ensuring that reconfiguration through strand displacement with FRET strands (and later CpGs) attached can still occur with a coating. Furthermore, the amount of coating and precise recipes would need to be made for our structure to maximise nuclease resistance with the ability to reconfigure. Again, this is an area of research that has not been extensively explored. Future tests could also involve testing interactions with other properties such as ionic properties, Mg²⁺ levels, and enzymatic activity.
Hence, this work is only commencing and is preliminary to future research on this topic, alongside the development of our flight ring.
To summarise our experimental process, we successfully assembled the 2D flight ring from Li et al.’s (2021) Topological Assembly of a Deployable Hoberman Flight Ring from DNA paper, and then attached FRET handles to the flight ring - achieving our two main experimental aims. We also are one of the first groups to explore purifying wireframe DNA origami through PEG precipitation.
Beyond these two aims, we were left with several immediate future research directions:
What is the optimal way to purify wireframe DNA origami? How else can we increase origami yield for our flight ring?
Exploration into the distance changes between FRET handles during the reconfiguration of the flight ring.
Creating a specialised oligolysine-PEG coating for the flight ring which is biostable and allows for reconfiguration.
Optimising purification methods for wireframe DNA nanostructures is a crucial step that would need to be done before continuing. Purifying DNA origami usually sees a big loss in yield across methods, so optimising our PEG precipitation method to maximise the yield is important. Considering PEG purification can provide more control over the final concentration of origami (Stahl et al., 2014), we believe it could be more beneficial to use than other purification methods like filtration. Another option for improving our origami yield is to increase the origami concentration by scaling the concentration of the components in the origami annealing mixture - in our case increasing the scaffold concentration from 5 nM to 20 nM, for example. This might work for our structure as the starting concentration was already quite low considering the purification required. However, for bigger and more complex structures it may not be practically possible to scale up all of the processes alongside concentration.
Further work in these areas would provide insight into overcoming current limitations in wireframe DNA origami synthesis and modification, which could have consequences in more complex nanostructures. Ultimately, our experimental work provides a strong foundation for developing a more robust proof of concept to attach CpGs to a reconfigurable DNA origami nanostructure for therapeutic applications.
Amicon Ultra-0.5 mL Centrifugal Filters for DNA and Protein Purification and Concentration—Sample Prep Centrifugal Filter Units. (n.d.). MerckMillipore. Retrieved November 3, 2024, from https://www.merckmillipore.com/AU/en/product/Amicon-Ultra-0.5mL-Centrifugal-Filters-for-DNA-and-Protein-Purification-and-Concentration,MM_NF-C82301?ReferrerURL=https%3A%2F%2Fwww.ecosia.org%2F&bd=1
Anastassacos, F. M., Zhao, Z., Zeng, Y., & Shih, W. M. (2020). Glutaraldehyde Cross-Linking of Oligolysines Coating DNA Origami Greatly Reduces Susceptibility to Nuclease Degradation. Journal of the American Chemical Society, 142(7), 3311–3315. https://doi.org/10.1021/jacs.9b11698
Eaton, P., Quaresma, P., Soares, C., Neves, C., De Almeida, M. P., Pereira, E., & West, P. (2017). A direct comparison of experimental methods to measure dimensions of synthetic nanoparticles. Ultramicroscopy, 182, 179–190. https://doi.org/10.1016/j.ultramic.2017.07.001
Energy Transfer. (n.d.). Salvatore Marras Laboratory: Designing Solutions for Your Assays. Retrieved November 13, 2024, from https://marraslab.com/energy_transfer/
Jun, H., Wang, X., Bricker, W. P., & Bathe, M. (2019). Automated sequence design of 2D wireframe DNA origami with honeycomb edges. Nature Communications, 10(1), 5419. https://doi.org/10.1038/s41467-019-13457-y
Knappe, G. A., Wamhoff, E.-C., & Bathe, M. (2022). Functionalizing DNA origami to investigate and interact with biological systems. Nature Reviews. Materials, 8(2), 123. https://doi.org/10.1038/s41578-022-00517-x
Li, R., Chen, H., & Choi, J. H. (2021). Topological Assembly of a Deployable Hoberman Flight Ring from DNA. Small, 17(11), 2007069. https://doi.org/10.1002/smll.202007069
Pike, Jarod. (n.d.). First ever nanoscale Hoberman structure built out of DNA origami. Mechanical Engineering - Purdue University. Retrieved November 3, 2024, from https://engineering.purdue.edu/ME/News/2021/None
Ponnuswamy, N., Bastings, M. M. C., Nathwani, B., Ryu, J. H., Chou, L. Y. T., Vinther, M., Li, W. A., Anastassacos, F. M., Mooney, D. J., & Shih, W. M. (2017). Oligolysine-based coating protects DNA nanostructures from low-salt denaturation and nuclease degradation. Nature Communications, 8(1), 15654. https://doi.org/10.1038/ncomms15654
Singh, M., Sharma, D., Garg, M., Kumar, A., Baliyan, A., Rani, R., & Kumar, V. (2022). Current understanding of biological interactions and processing of DNA origami nanostructures: Role of machine learning and implications in drug delivery. Biotechnology Advances, 61, 108052. https://doi.org/10.1016/j.biotechadv.2022.108052
Stahl, E., Martin, T. G., Praetorius, F., & Dietz, H. (2014). Facile and Scalable Preparation of Pure and Dense DNA Origami Solutions. Angewandte Chemie International Edition, 53(47), 12735–12740. https://doi.org/10.1002/anie.201405991
Shrestha, D., Jenei, A., Nagy, P., Vereb, G., & Szöllősi, J. (2015). Understanding FRET as a Research Tool for Cellular Studies. International Journal of Molecular Sciences, 16(12), 6718–6756. https://doi.org/10.3390/ijms16046718
Wickham, S. F. J., Auer, A., Min, J., Ponnuswamy, N., Woehrstein, J. B., Schueder, F., Strauss, M. T., Schnitzbauer, J., Nathwani, B., Zhao, Z., Perrault, S. D., Hahn, J., Lee, S., Bastings, M. M., Helmig, S. W., Kodal, A. L., Yin, P., Jungmann, R., & Shih, W. M. (2020). Complex multicomponent patterns rendered on a 3D DNA-barrel pegboard. Nature Communications, 11(1), 5768. https://doi.org/10.1038/s41467-020-18910-x
Ye, J., Teske, J., Kemper, U., & Seidel, R. (2021). Sequential Pull-Down Purification of DNA Origami Superstructures. Small, 17(17), 2007218. https://doi.org/10.1002/smll.202007218
Zeng, Y. C., Young, O. J., Wintersinger, C. M., Anastassacos, F. M., MacDonald, J. I., Isinelli, G., Dellacherie, M. O., Sobral, M., Bai, H., Graveline, A. R., Vernet, A., Sanchez, M., Mulligan, K., Choi, Y., Ferrante, T. C., Keskin, D. B., Fell, G. G., Neuberg, D., Wu, C. J., … Shih, W. M. (2024). Fine tuning of CpG spatial distribution with DNA origami for improved cancer vaccination. Nature Nanotechnology, 19(7), 1055–1065. https://doi.org/10.1038/s41565-024-01615-3
